The Serial Studio Blog
Plain-language guides to serial ports, MQTT, CAN bus and Modbus, plus how to see live data without building a dashboard.
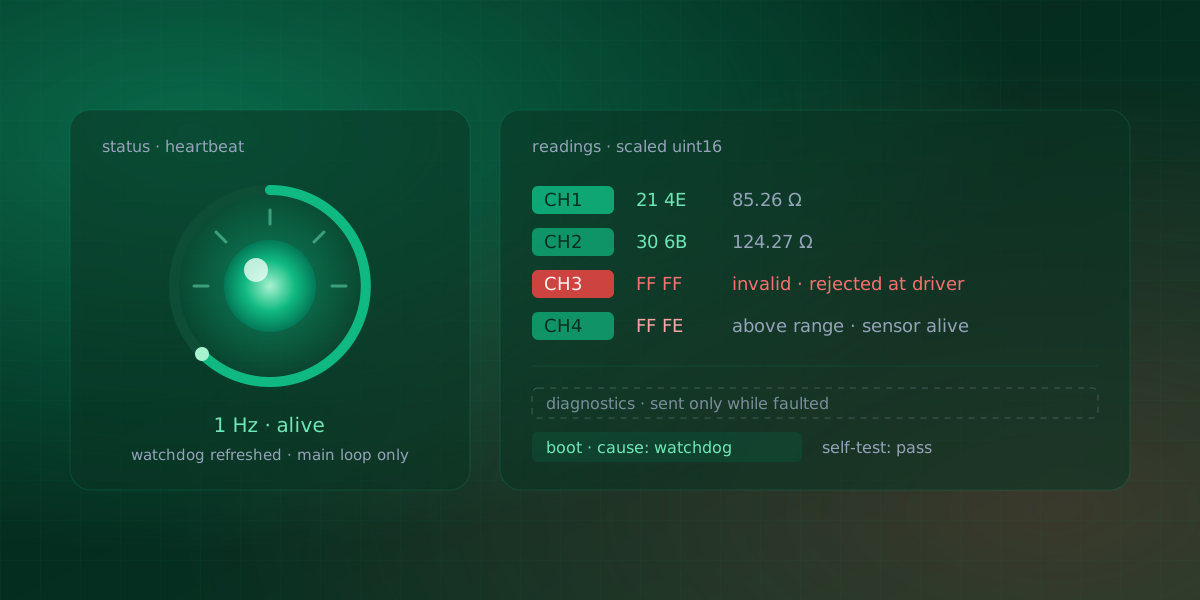
Telemetry You Can Trust: Lessons from Production Firmware
A dashboard will happily plot anything it receives. It cannot know that a sensor chip silently reset two seconds ago, that channel 5 has been repeating its last good reading since a connector worked loose, or that the number it just drew came from a converter that was mid-fault when the register was read. Whether the picture on screen means anything is decided earlier, in firmware, by code that runs next to the sensor.
Read the story →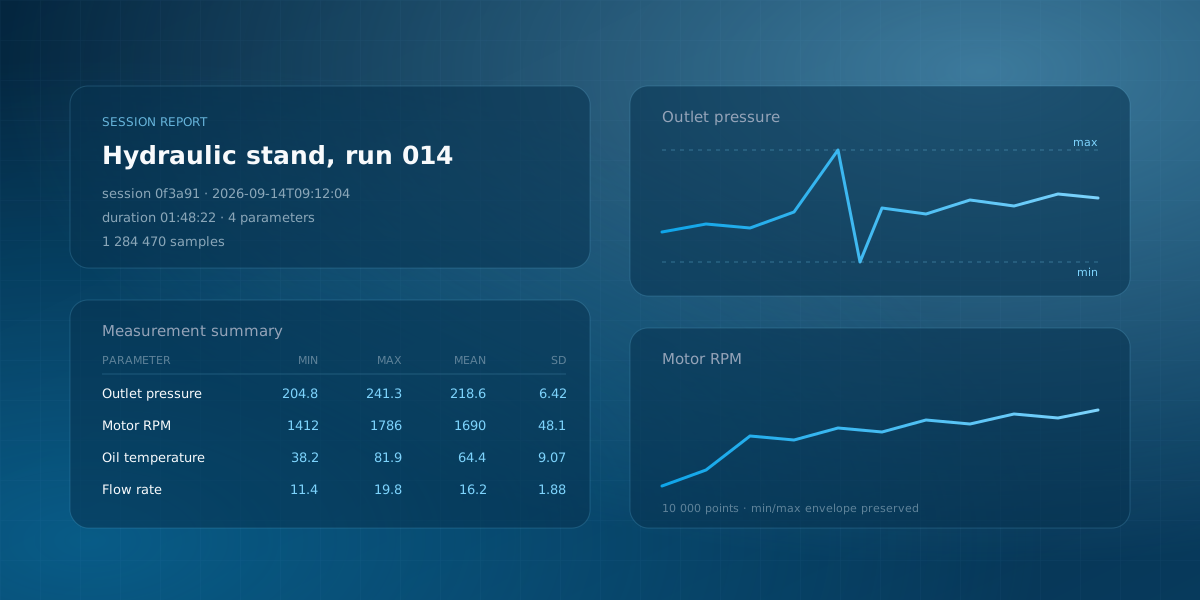
Sign the Test Report, Not the Spreadsheet
There is a workflow that almost every test stand converges on, and almost nobody chose. A run finishes. Somebody exports a CSV. The CSV goes into Excel. Somebody makes charts, adjusts the axes, pastes them into a template, types the min and max into a table, exports a PDF, and sends it for signature.
8 min read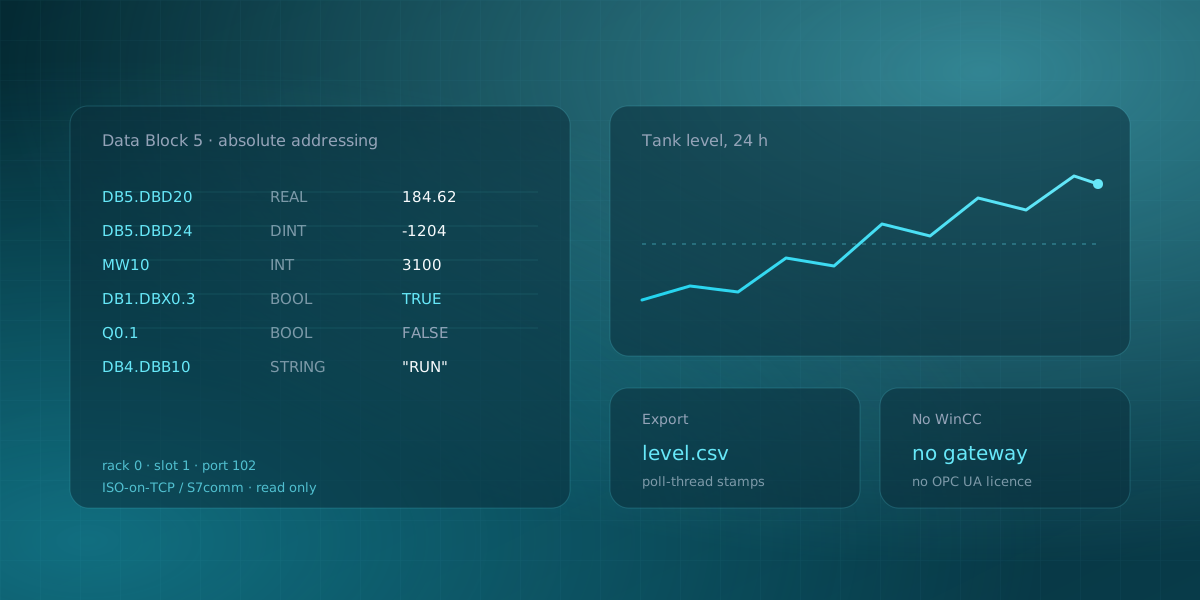
Log a Siemens S7-1200 to CSV Without WinCC
You need a week of trend data off an S7-1200. Maybe a commissioning engineer wants to see whether a tank level is drifting overnight, maybe quality wants the temperature curve from a batch, maybe you are chasing an intermittent fault that only shows up on second shift. The data is sitting in a data block inside the CPU. Getting it onto a disk should be a small problem.
8 min read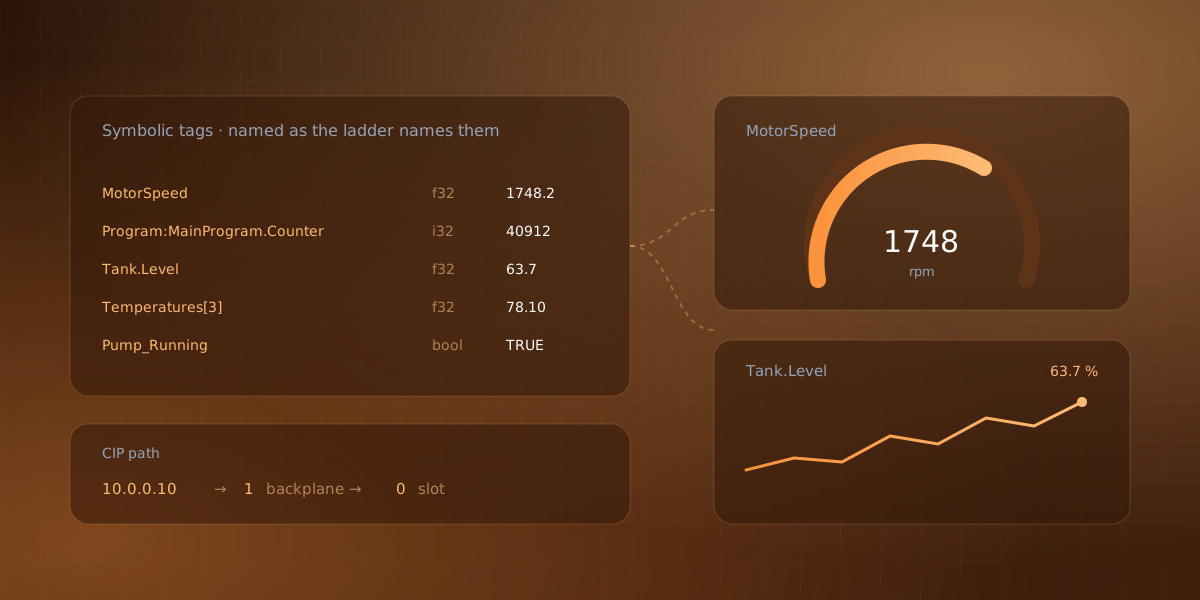
Read Allen-Bradley Tags Without RSLinx
Rockwell's ecosystem is coherent and well supported, and it is also a commitment. If you want to look at four tags on a CompactLogix, the well-trodden path runs through RSLinx Classic or FactoryTalk Linx, which means an installation, a licence on somebody's machine and usually a conversation with whoever administers it. That is entirely reasonable for an HMI that will run for a decade. It is a lot of ceremony for "is the tank level actually moving?"
7 min read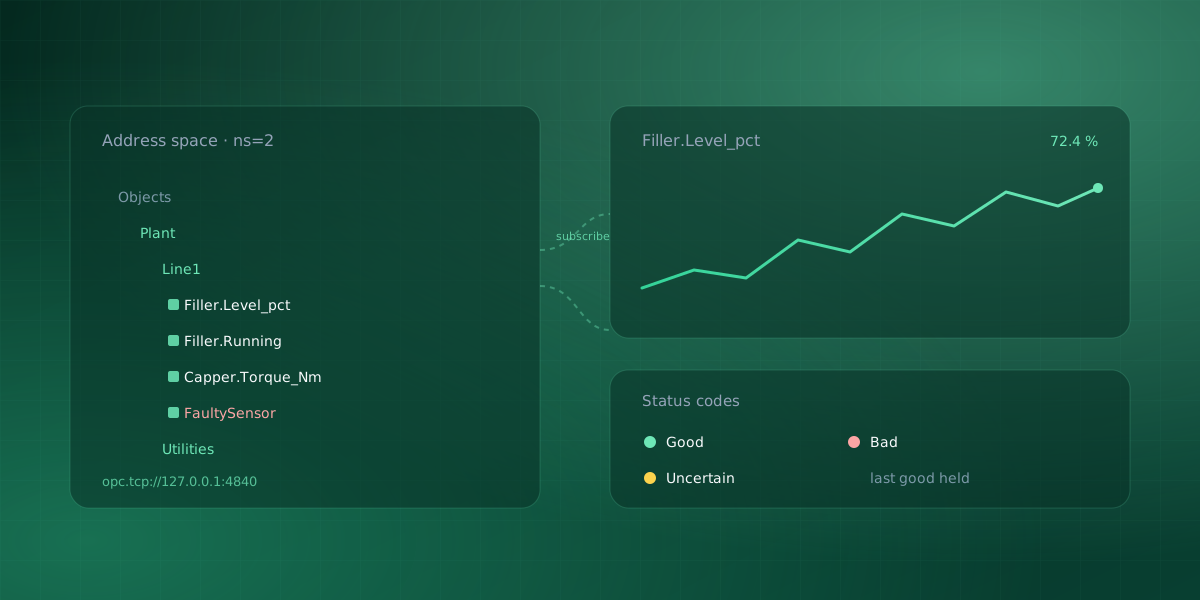
An OPC UA Client That Trends, Records and Reports
There is a gap in the OPC UA tooling most people have on their laptop. On one side there are browsers: point them at a server, expand the tree, watch a number tick over in a table. Excellent for answering "is this tag alive?" On the other side there is SCADA, which trends and records and archives beautifully, and which costs a seat and a project and a commissioning week.
8 min read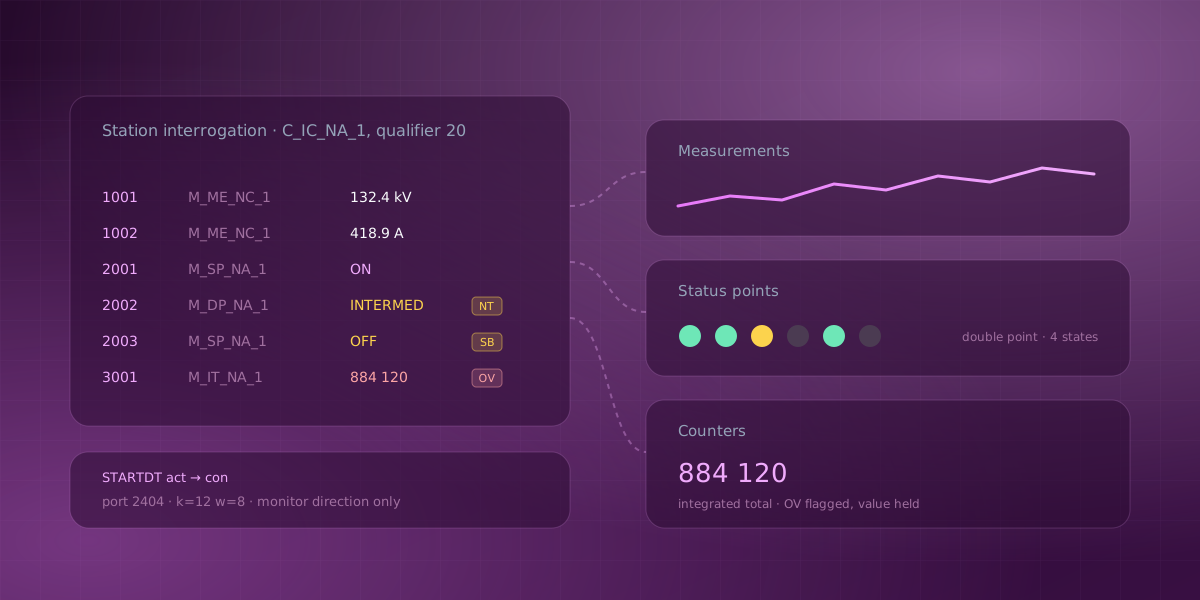
Watch an IEC 60870-5-104 Link From a Laptop
Most protocols make you say what you want before you can have it. Modbus needs a register map. S7comm needs absolute addresses. EtherNet/IP needs tag names. You arrive with a spreadsheet, or you do not arrive.
7 min read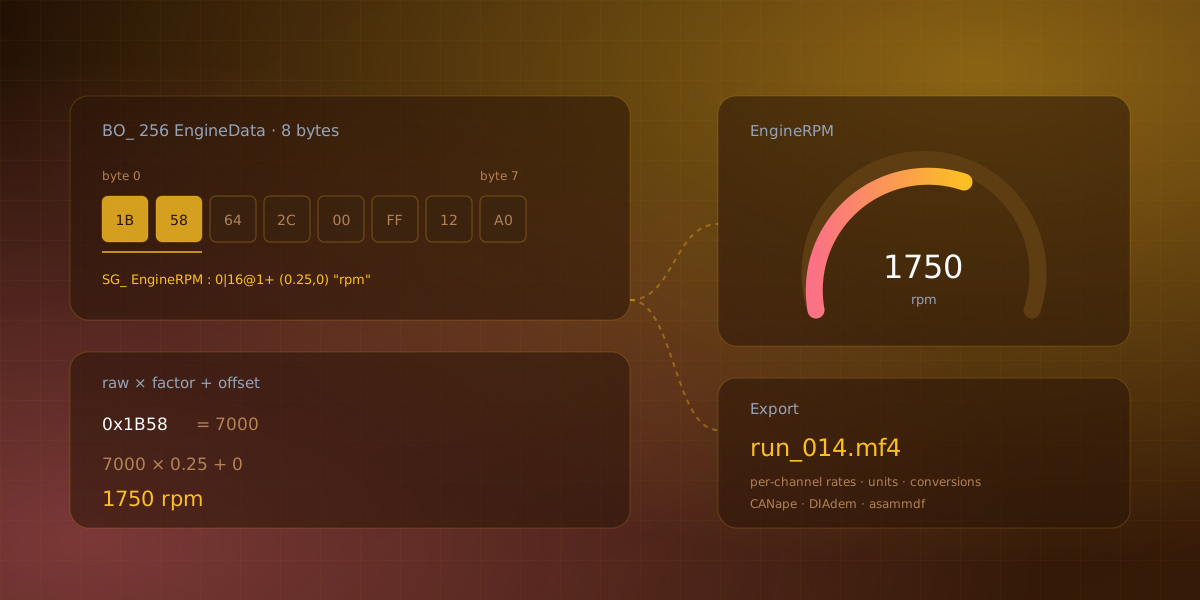
From a DBC File to a Live CAN Dashboard and MDF4
Raw CAN is bytes in a message. 0x100 arrives with eight bytes and the bus does not tell you that bits 0 through 15 are engine RPM scaled by 0.25. That knowledge lives in a DBC file, and if you have one, most of the work of building a dashboard is already done. It just is not obvious that it is done.
7 min read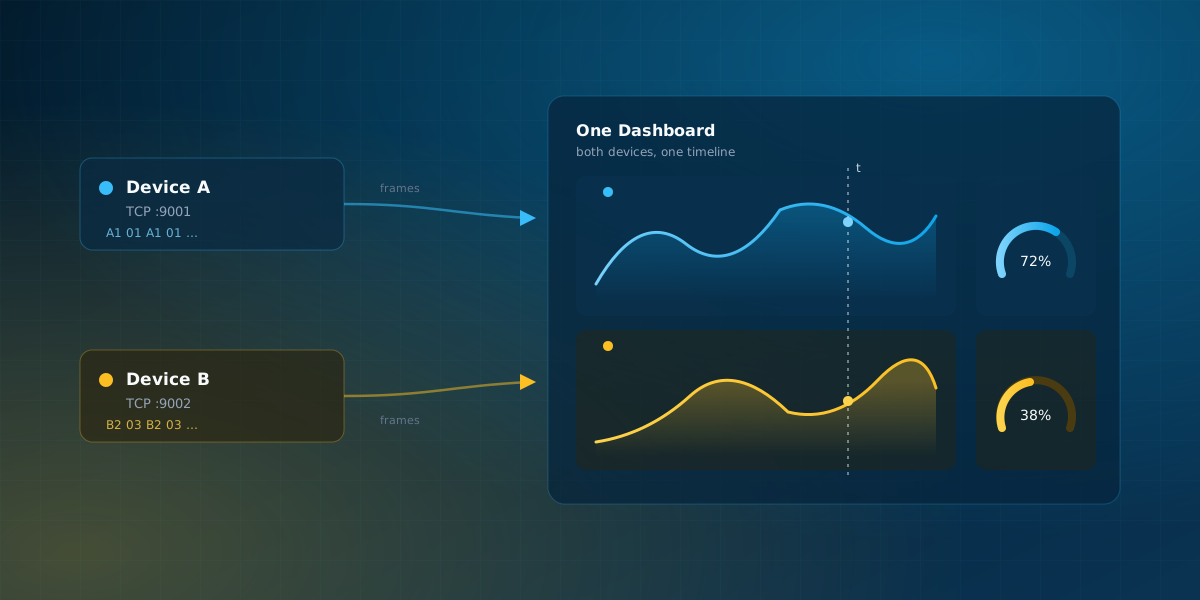
Monitor Multiple Devices on One Dashboard
Sooner or later a project outgrows one cable. A flight computer and a ground sensor. A device under test and the instrument measuring it. Two nodes of the same robot. The moment two devices matter to the same experiment, you hit a limitation that almost every serial tool shares: it opens one port at a time.
8 min read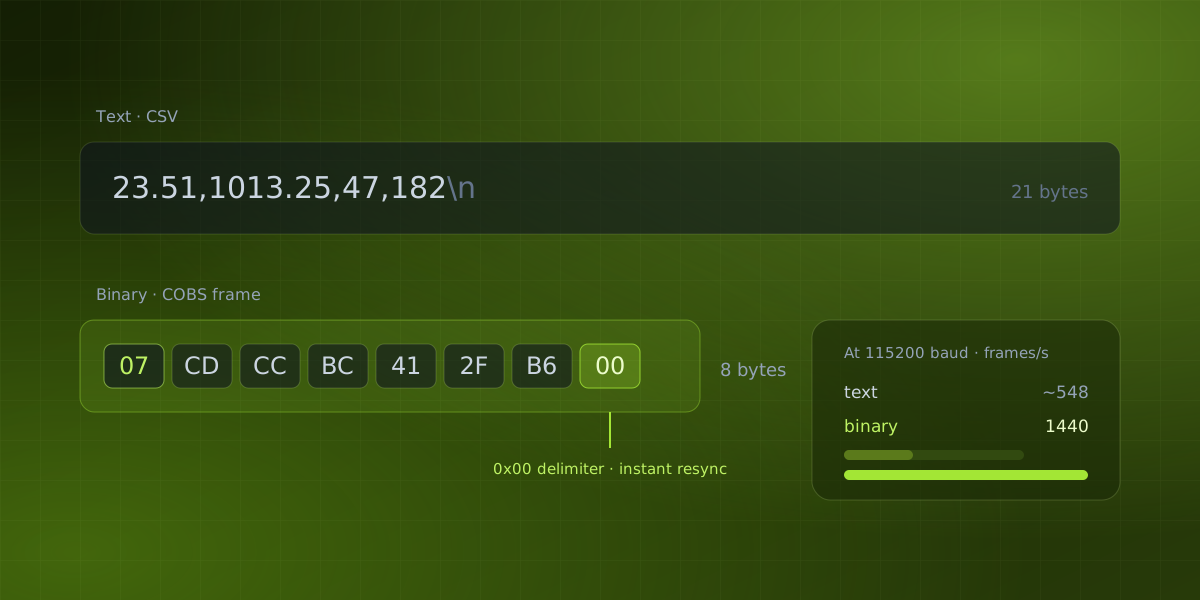
Binary Serial Protocols: COBS & MessagePack
Sending 23.51,1013.25,47,182\n over a serial port is a perfectly good idea, right up until it isn't. Text is easy to debug, every tool on Earth reads it, and at one sample per second it costs nothing. But push the sample rate up and two bills come due at once: the wire runs out of bandwidth, and the microcontroller burns cycles turning floats into strings. This post walks through the arithmetic, then through the two techniques that fix it: COBS for framing and MessagePack for encoding.
9 min read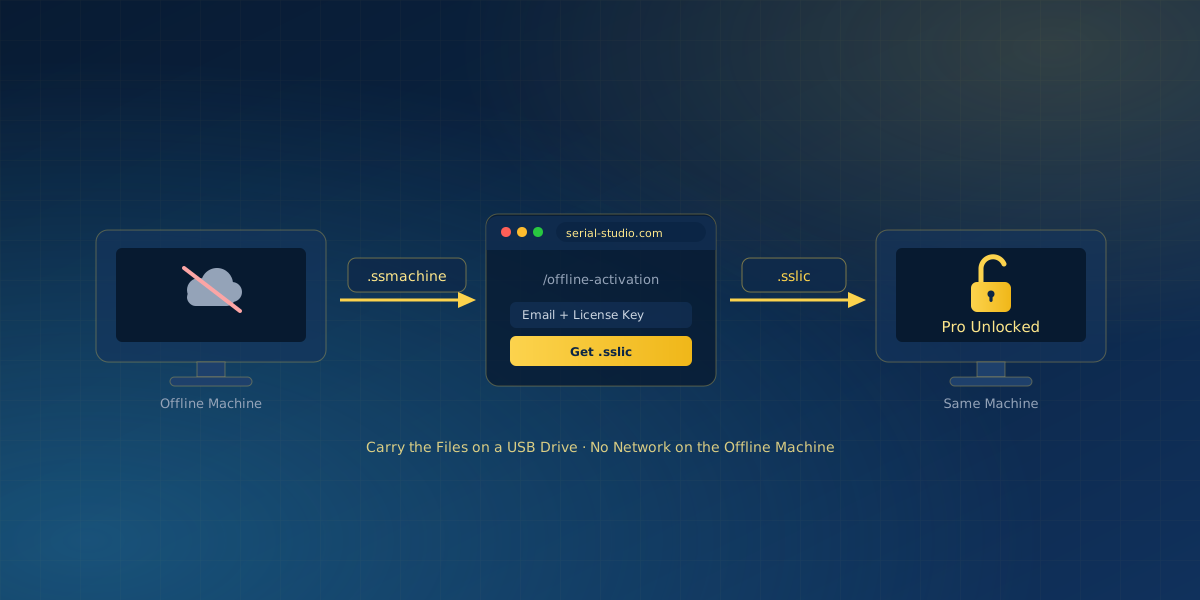
Activate Serial Studio Pro Offline
Some of the machines that run Serial Studio never touch the internet. Industrial benches, locked-down deployments, and genuinely air-gapped systems cannot do a normal online license check. Offline activation exists for exactly these cases: instead of validating over the network, the machine imports a signed license file that you fetch once from the activation website.
4 min read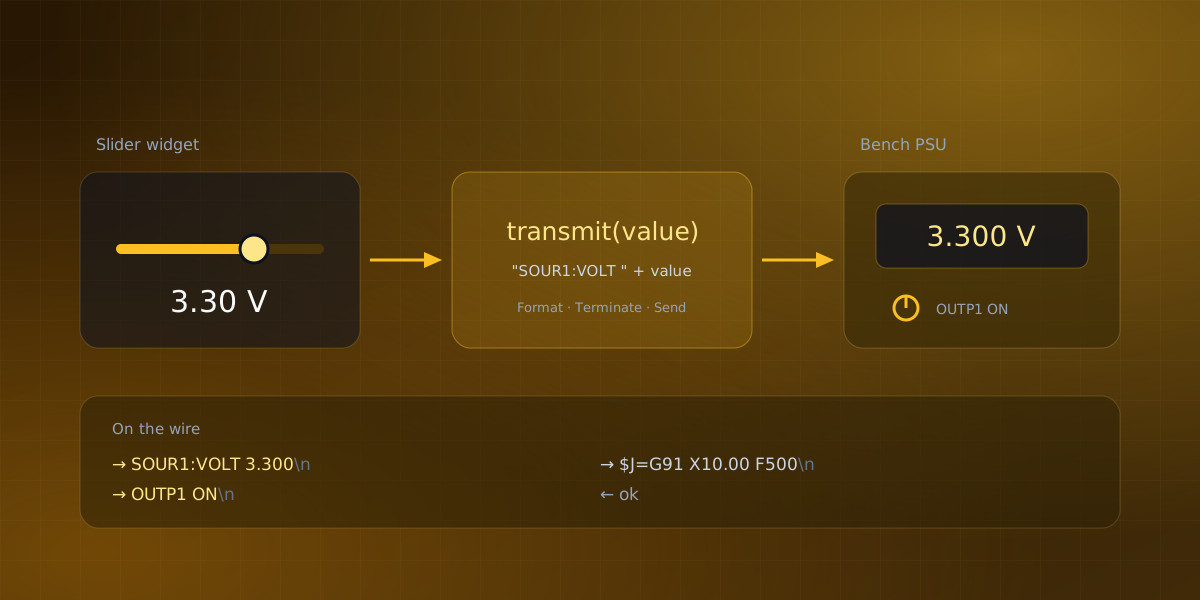
Send SCPI and G-code From Your Dashboard
Reading data from a device is passive. Whatever arrives, you parse it, plot it, and nothing bad happens if you get it slightly wrong. Sending a command is a transaction: it has to be formatted exactly the way the device expects, terminated correctly, and acknowledged. That asymmetry is why so many home-grown dashboards are read-only. This post looks at the two command languages you are most likely to meet, SCPI on the bench and G-code on a machine, and at what it takes to wire a slider or a switch to them.
9 min read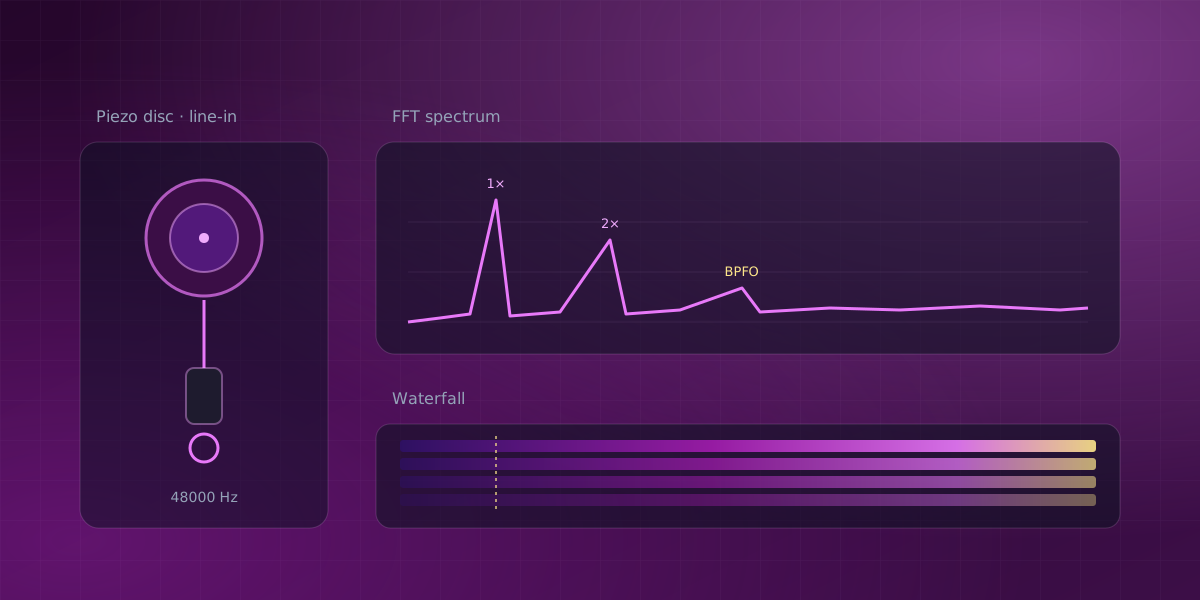
Vibration Analysis With a Sound Card and FFT
Your computer already contains a two-channel, 16-or-24-bit ADC that samples at 48,000 times per second or better. It is called the sound card, and for questions like "is this motor vibrating more than it did last month," it is a legitimate measurement front end, as a long tradition of sound-card oscilloscope projects attests. Paired with a piezo disc that costs less than a coffee, it will show you a vibration spectrum. This post covers the electronics you need between the disc and the jack, what the spectrum means once you see it, and, just as important, what this rig cannot tell you.
9 min read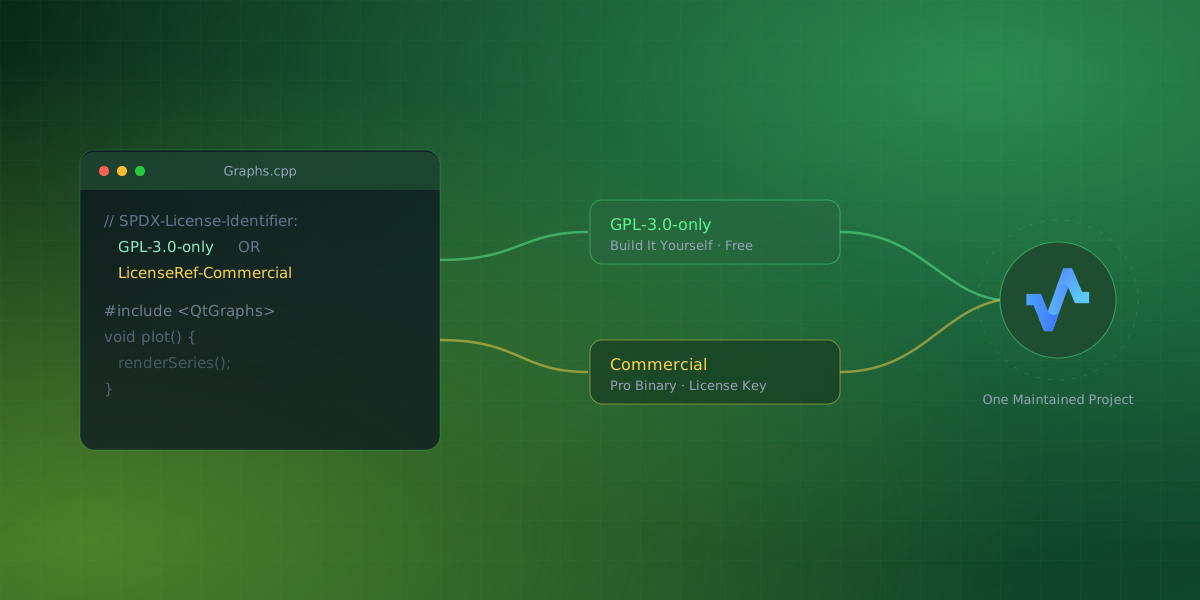
Why Serial Studio Has a Pro License
I get a version of this question often: if Serial Studio is open source, why isn't it just free? It is a fair thing to ask, and it deserves an honest answer rather than a marketing one. So here is the whole story, including how the license actually works and why it is built this way.
7 min read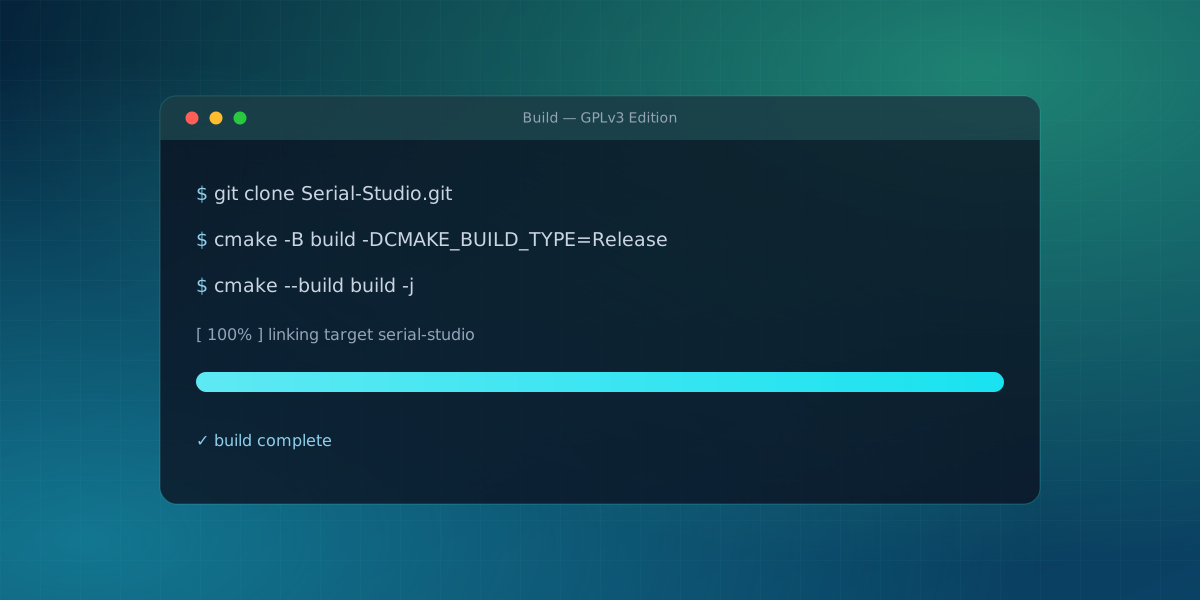
Build Serial Studio From Source (GPLv3)
Serial Studio's core is free and open source under the GPLv3, and building it yourself is straightforward. You might do it to run the fully open edition, to audit what the app does, or to contribute a fix. This walks through the requirements and the build on each platform. It follows the instructions in the project's repository, which is the source of truth if anything here drifts.
6 min read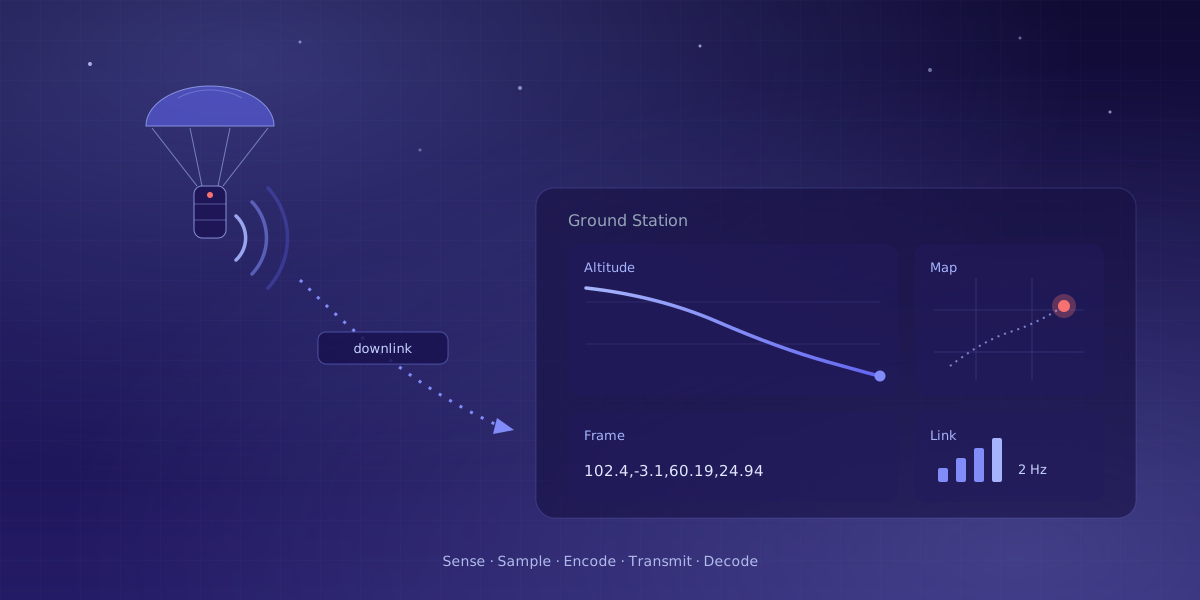
What Is Telemetry? How Live Data Gets Home
Telemetry is measurement at a distance. The word says exactly that: tele, far, and metron, measure. A rocket cannot pull over so an engineer can read a pressure gauge, a race car cannot stop mid-lap to have its tire temperatures checked, and a weather balloon is not coming back in any useful condition. Telemetry is the discipline of getting the measurement to come to you.
7 min read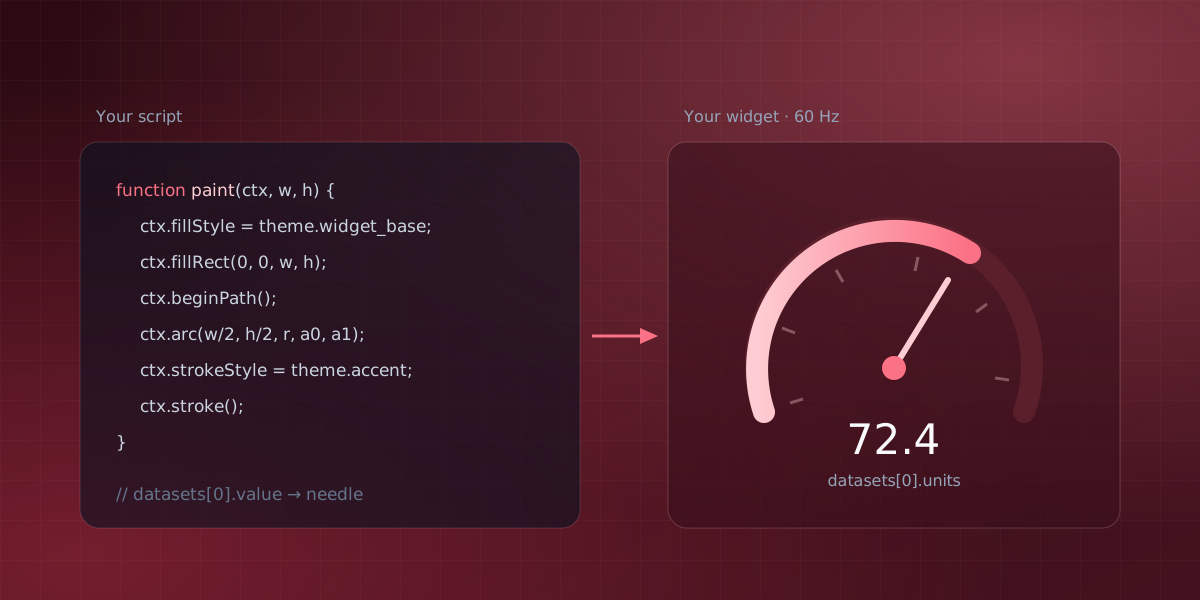
Draw a Custom Dashboard Widget With Canvas2D
Dashboards are built from a vocabulary of standard widgets: plots, gauges, bars, compasses, LED panels. When none of them fit, the escape hatch is the Painter widget, part of Serial Studio Pro: a blank canvas that runs a drawing script you write. Serial Studio ships more than twenty prefab widgets, and most instruments you will ever need are in that set. But every so often the right visualization for your data simply does not exist as one: a seven-segment readout, a polar plot, an attitude indicator drawn your way. If you have ever drawn on a <canvas> element in a browser, you already know how to use the Painter.
7 min read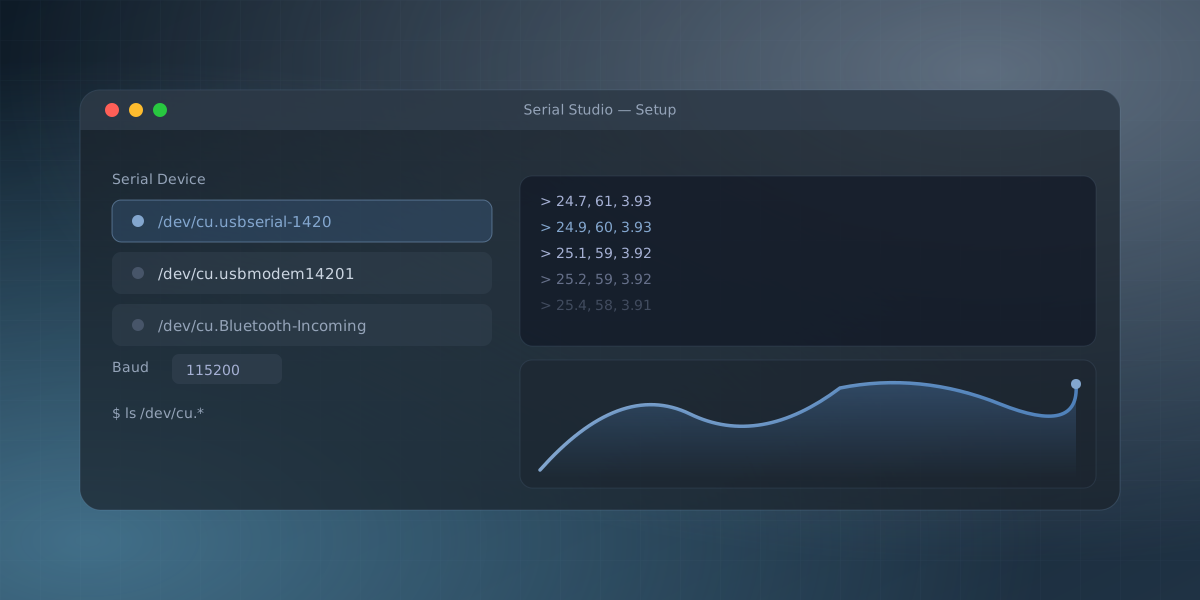
Serial Monitor on macOS: Terminal Tools and a Native App
On Windows, when you need to look at a serial port you reach for PuTTY, RealTerm, or the vendor's tool. On macOS there is no equivalent that ships with the system. You get two command-line utilities, screen and cu, and that is the whole toolbox. For a lot of people this is the first surprise after switching to a Mac for embedded work. If you're on Windows instead, the equivalent guide covers COM ports and PuTTY.
5 min read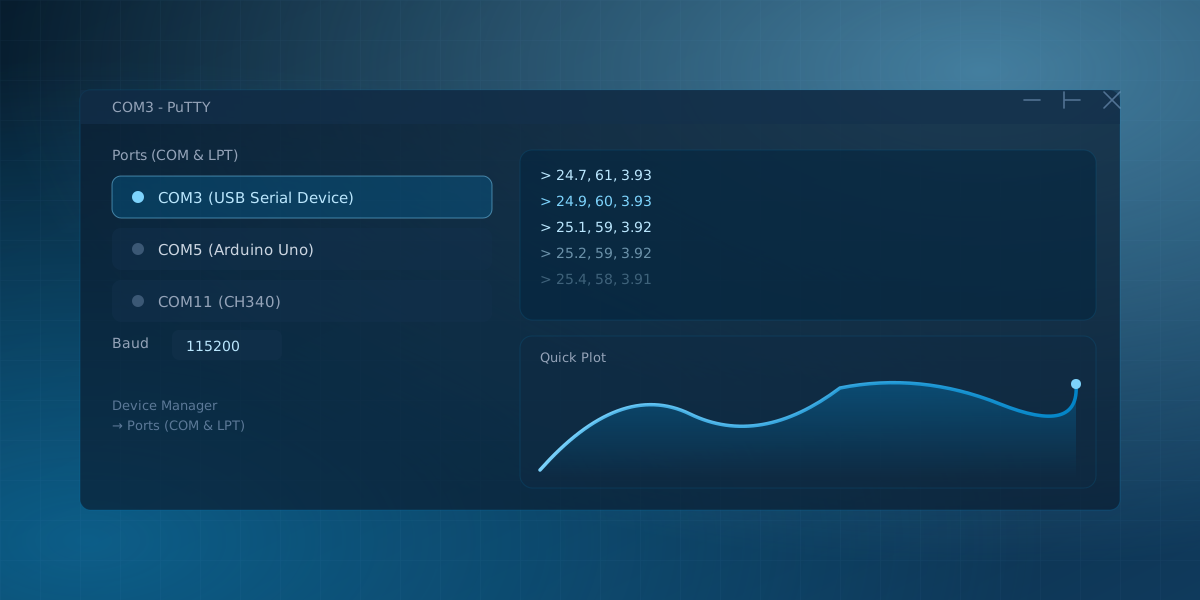
Serial Monitor on Windows: Terminal Tools and a Native App
PuTTY is the first serial tool most Windows users install, and it earns that spot honestly: it is free, it has been rock solid for two decades, and it opens a COM port in a few clicks. What it does not do is plot a number. PuTTY, Tera Term, and the Arduino IDE's Serial Monitor all treat a serial port as a stream of text, because that is exactly what an SSH or telnet client is built to do. The moment your device sends comma-separated sensor readings instead of log lines, that design starts to show its seams.
6 min read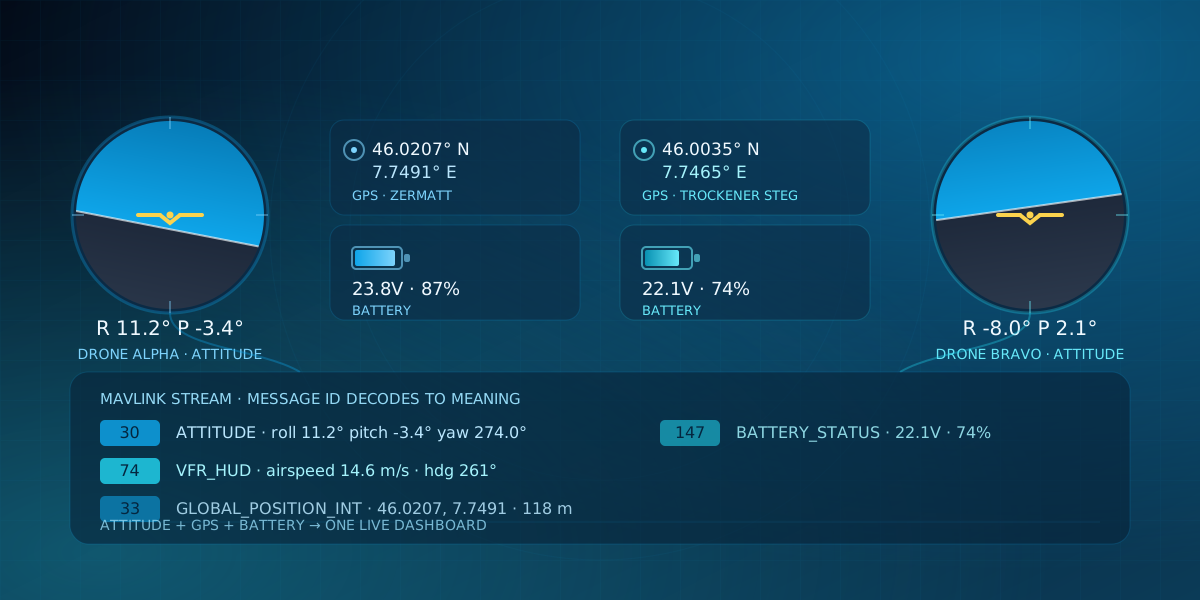
What Is MAVLink? Drone Telemetry Explained
Every ArduPilot or PX4 flight controller reports its attitude, GPS position, and battery state to a ground station using the same protocol: MAVLink. If you've seen the name mentioned in drone build logs, CanSat writeups, and rocketry telemetry projects without ever seeing it explained, here's what a MAVLink message actually looks like, and how to watch one flow with no drone in the room.
7 min read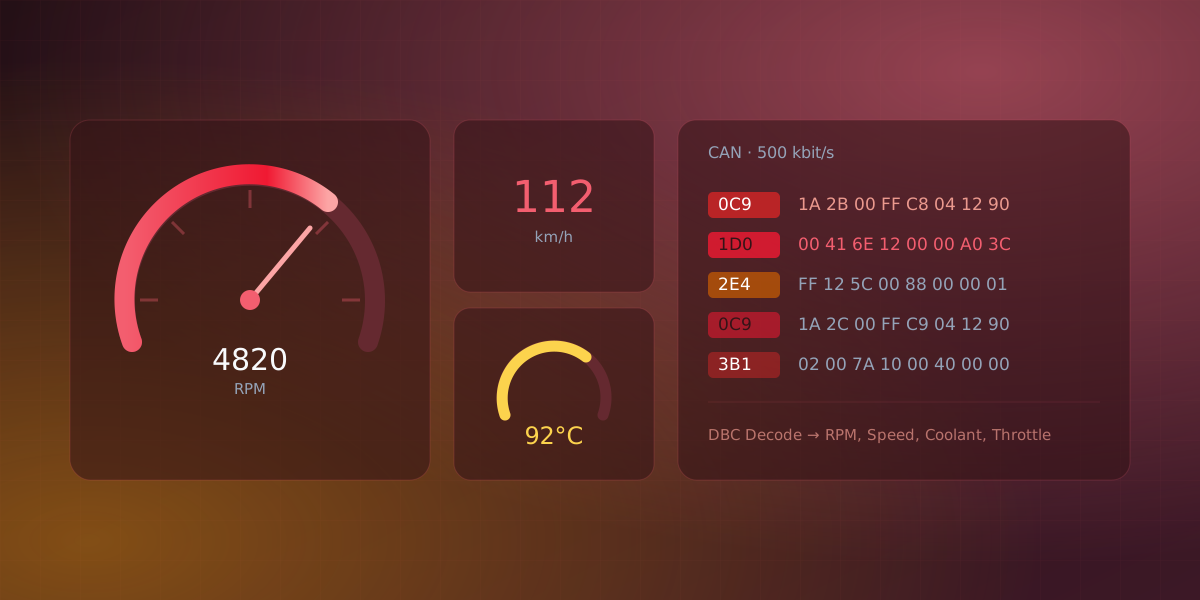
What Is the CAN Bus, and How Do You Read It?
Open the hood of any car built in the last thirty years and you are looking at a CAN bus. CAN (Controller Area Network) is a broadcast bus where every module shares one twisted pair of wires and messages carry priority-ranked IDs instead of addresses. It is also common in industrial machines, electric drivetrains, and any embedded system spread across more than one board. If you have ever wanted to read the data flowing through one, it helps to understand what CAN is first, because it behaves differently from the serial and network links most people start with.
6 min read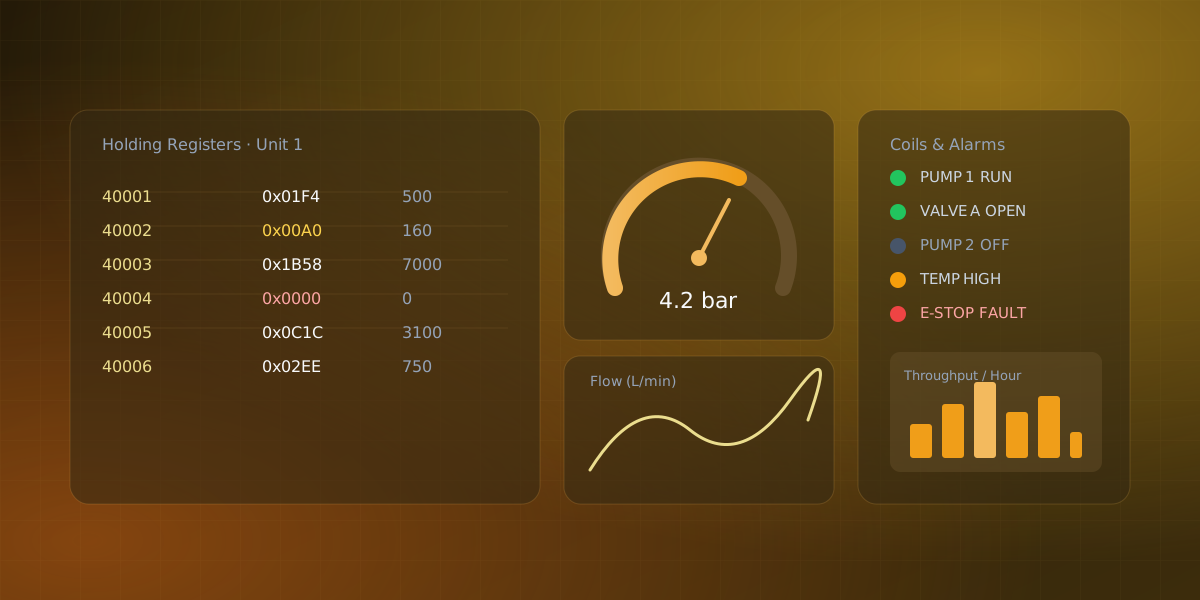
What Is Modbus? A Practical Field Guide
Modbus is a simple request/response protocol in which one master polls registers and coils from many slave devices. It is also one of the oldest protocols still in daily use, and if you work anywhere near factory floors, building automation, or energy metering, you will run into it. It is refreshingly simple once the vocabulary clicks. This is a practical tour of what Modbus is and how to read a device that speaks it.
6 min read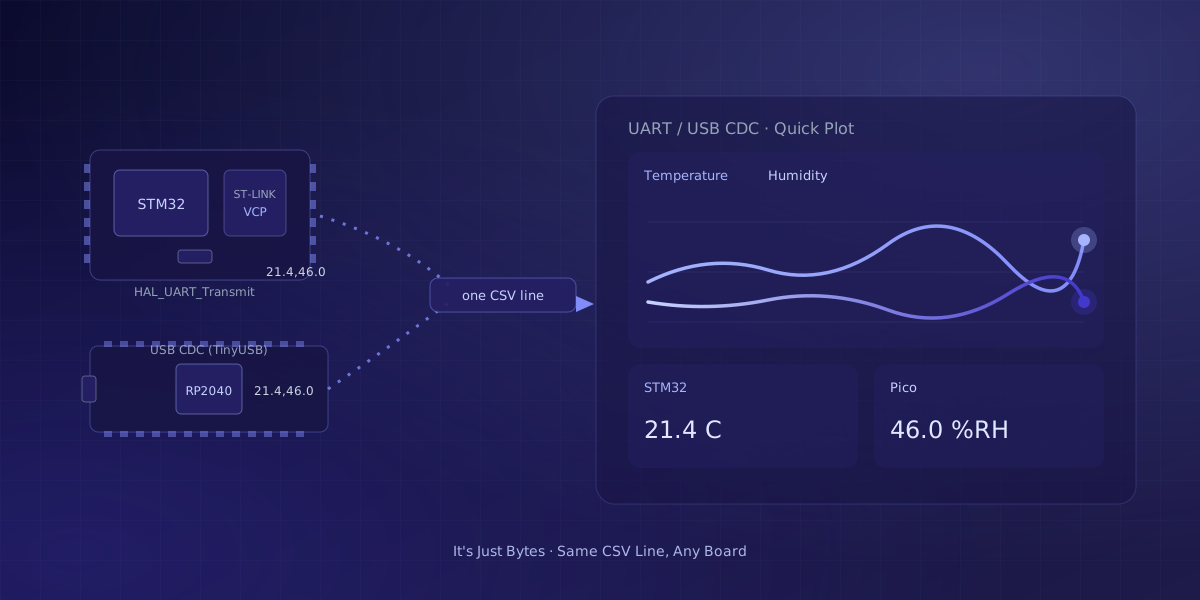
Serial Studio with STM32 and Raspberry Pi Pico
Serial Studio's driver list names Arduino, ESP32, STM32, and plain USB-to-serial adapters in the same breath, and that is not an accident. The app does not know or care which chip put the bytes on the wire; it only reads them. That single fact is why an STM32 board wired for a real project and a five-dollar Raspberry Pi Pico bought for a weekend both work the moment their firmware prints a line of comma-separated values. This post walks through the actual code for both boards, plain HAL or retargeted printf on the STM32 side, and the C SDK's USB CDC stdio on the Pico side, and points out where each board's setup genuinely differs from the Arduino habit most tutorials assume.
7 min read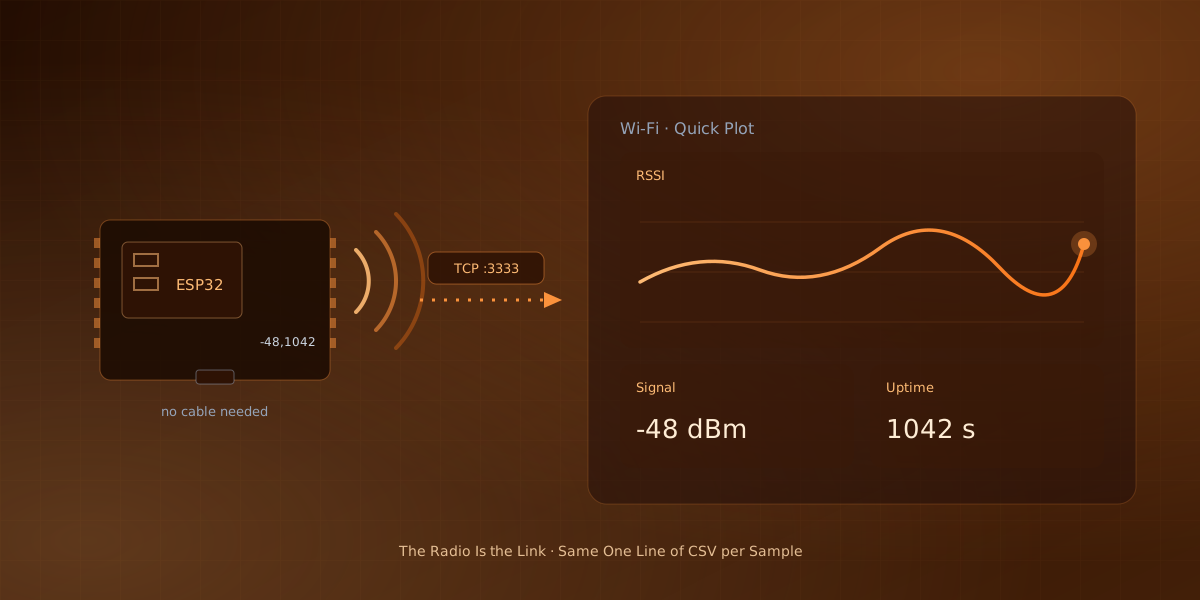
Send ESP32 Sensor Data Over Wi-Fi
The ESP32's radio is the reason most people pick it, and yet a surprising number of projects still stream their sensor data through the USB cable. Usually that is because the serial monitor is the tool at hand, and sending data over Wi-Fi sounds like it needs a server, a protocol, and an evening of reading. It needs none of that. A plain TCP socket and the same comma-separated lines you already print are enough, and this post walks through the whole thing.
7 min read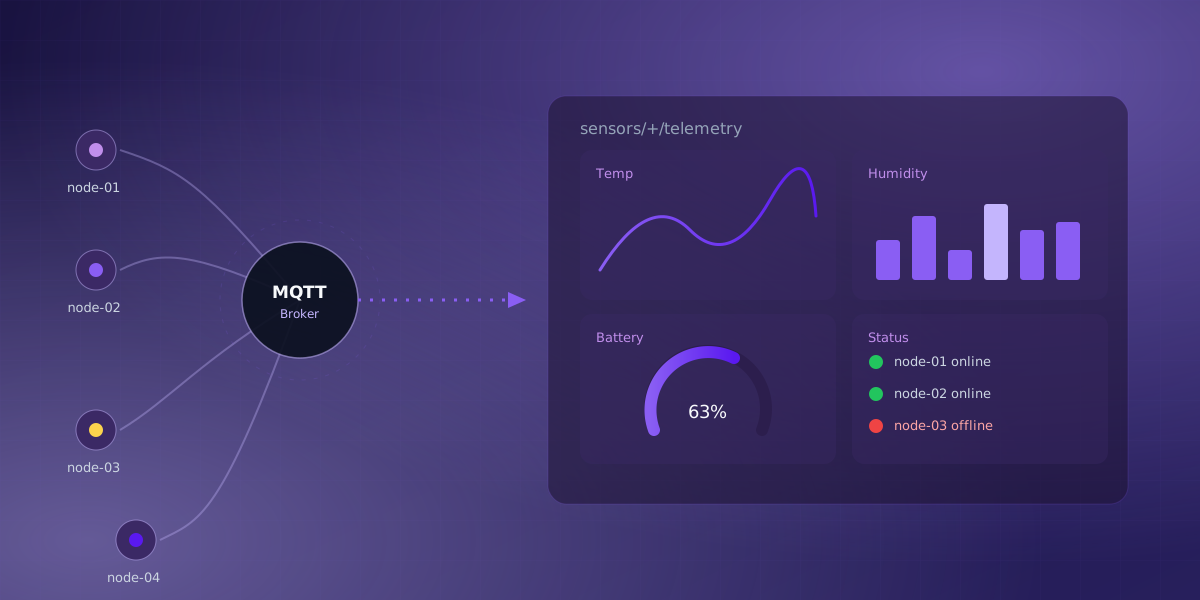
What Is MQTT? See a Live Feed in Minutes
MQTT is a lightweight publish/subscribe messaging protocol in which clients exchange messages through a central broker, and it quietly runs a large part of the connected world, from home-automation sensors to industrial telemetry. If you have seen it mentioned in IoT tutorials and never quite pinned down what it does, this is the short version, followed by a way to watch a real MQTT feed in a couple of minutes without buying anything.
5 min read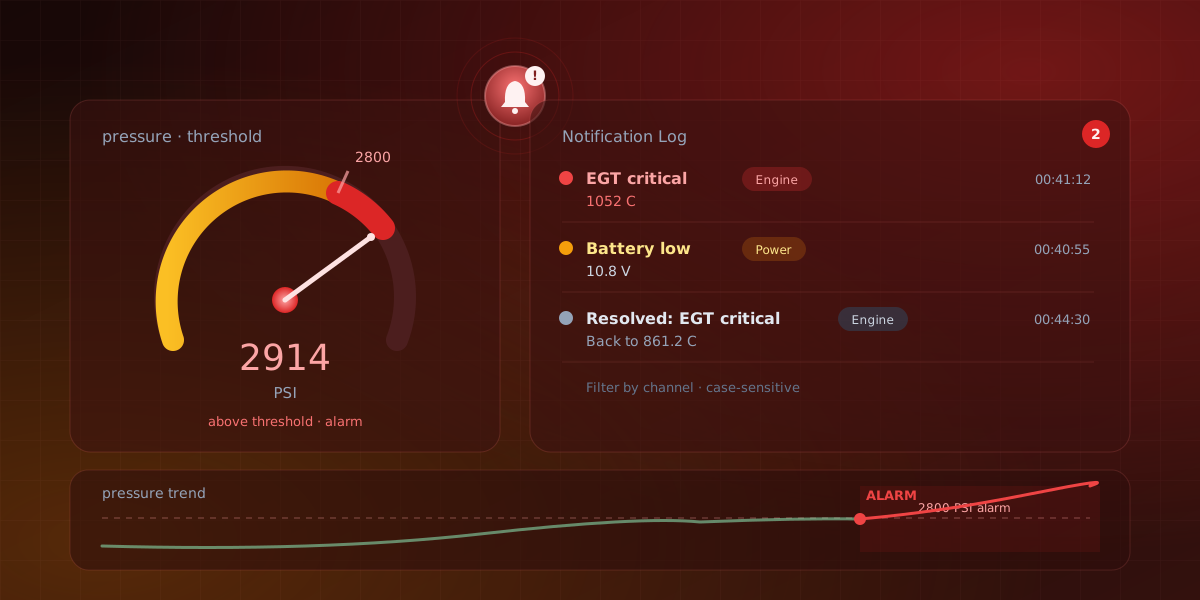
Alarms and Notifications: Don't Miss a Threshold Crossing
A plot is a great way to watch one channel. Add a dozen more, and a human eye can't reliably hold that many moving lines at once, so a reading drifting past its safe limit can slide by unnoticed for minutes. Serial Studio's answer isn't a fancier chart. It's a notification: a script decides a value crossed a line and posts an event to a shared log, instead of asking you to catch a slope change on a plot. This post covers what the feature actually does: three severity levels, a shared event bus fed from five different places in the pipeline, and a scripted latch-and-resolve pattern for alarms that shouldn't nag on every frame.
10 min read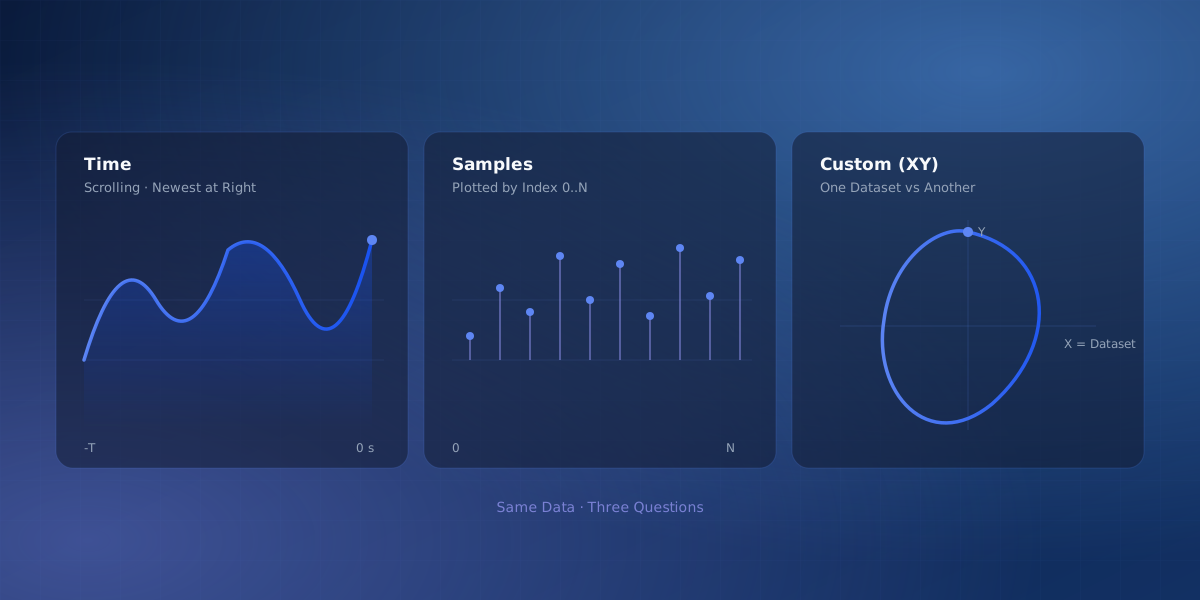
A Plot's X Axis: Time, Samples, or Custom
When you put a signal on a chart you are really plotting two things: the value on the Y axis, and whatever you are measuring it against on the X axis. Most tools quietly assume the X axis is time and never ask. That default is usually right, but not always, and the cases where it is wrong are exactly the ones that produce a "my graph looks weird" moment. Serial Studio lets a plot use one of three kinds of X axis, and picking the right one clears up a surprising amount of confusion.
6 min read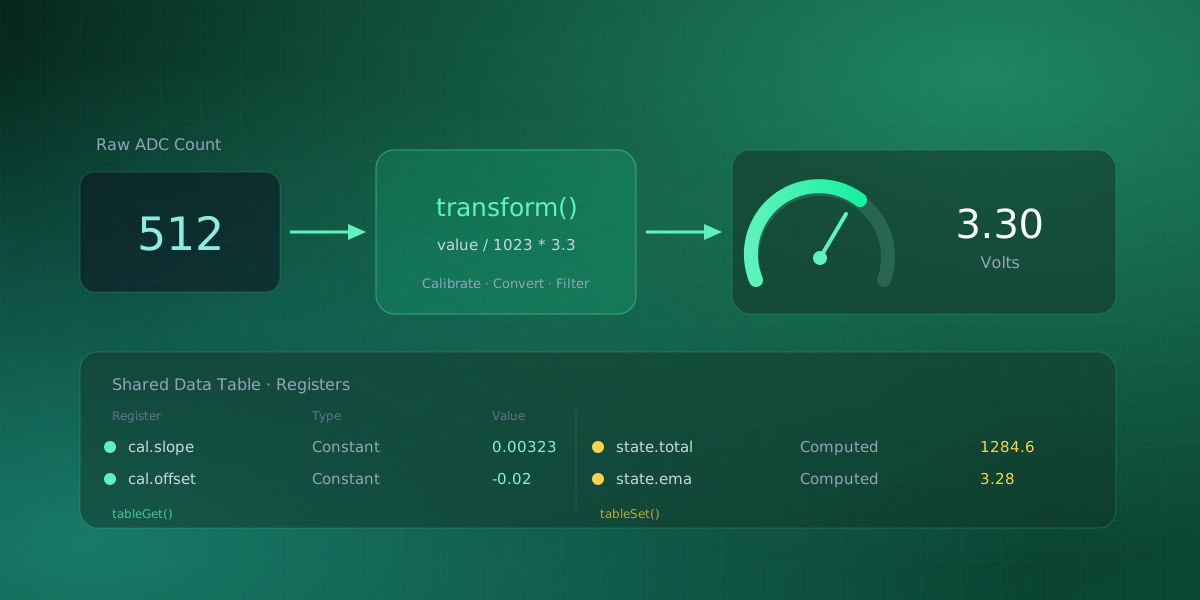
Calibrate Sensor Data: Counts to Real Units
A sensor almost never hands you the number you actually want. A 10-bit ADC gives you 0 to 1023, not volts. A thermistor gives you counts, not degrees. A load cell gives you millivolts, not kilograms. Somewhere between the raw reading and the dashboard, that value has to become a real, calibrated engineering quantity. The interesting question is where that conversion should happen.
8 min read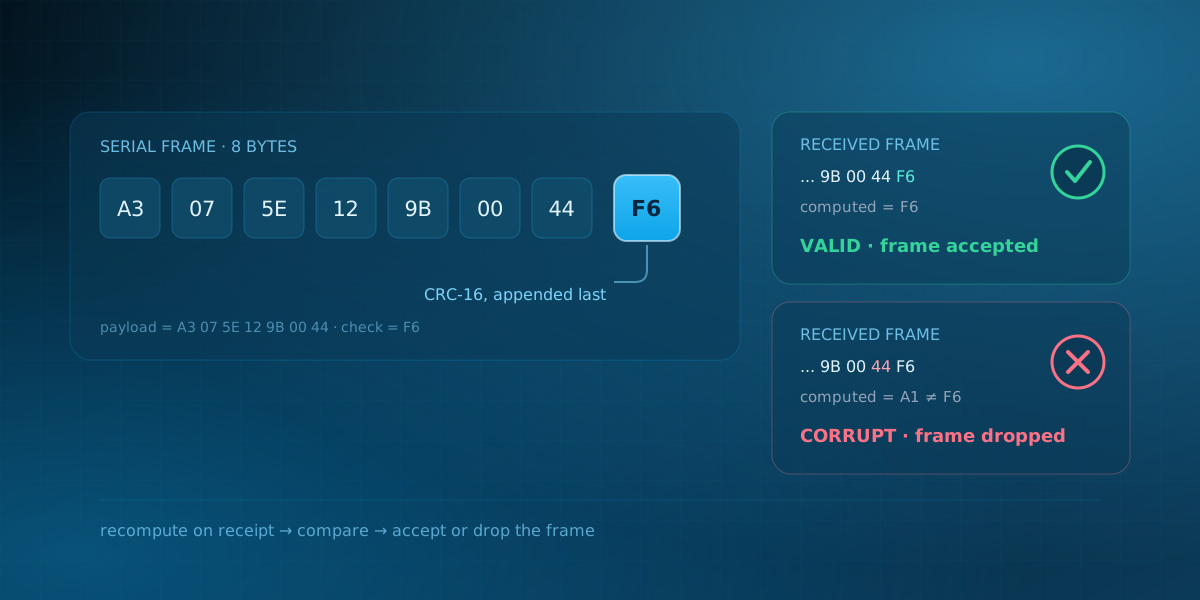
Checksums and CRC, Explained
Every serious wire protocol ends its frames with a few extra bytes that look like noise but aren't. A checksum or CRC is a small number computed from the payload, sent alongside it, and recomputed by the receiver to catch bit-level corruption before it becomes a wrong reading on a dashboard. This post explains what those bytes actually protect against, why CRC beats a plain sum, and which variant shows up in which protocol.
10 min read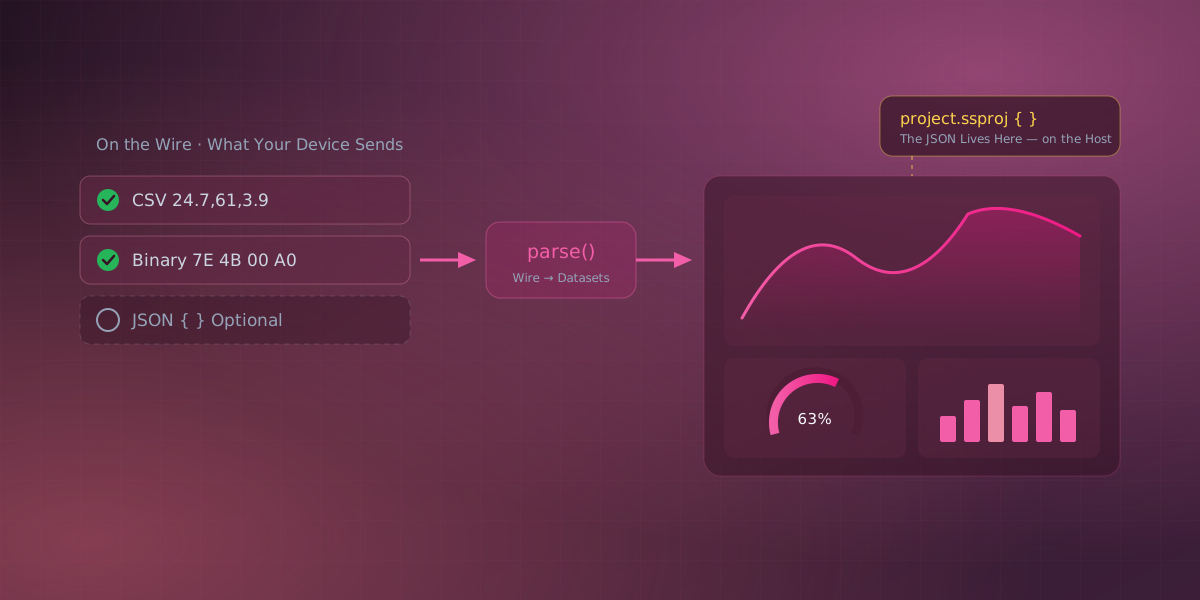
No, Your Device Doesn't Have to Send JSON
No, your device does not have to send JSON to work with Serial Studio. It never did. The misconception is one of the most common ones about the app, and it has tripped up a lot of people over the years. Somebody sees the Project Editor described as editing "JSON project files," or notices the project saves as a .ssproj (which is JSON), and concludes that their microcontroller has to output JSON. Then they go write a JSON serializer on an 8-bit micro, watch it eat their flash and their loop time, and wonder why such a simple task got so hard. It didn't have to.
4 min read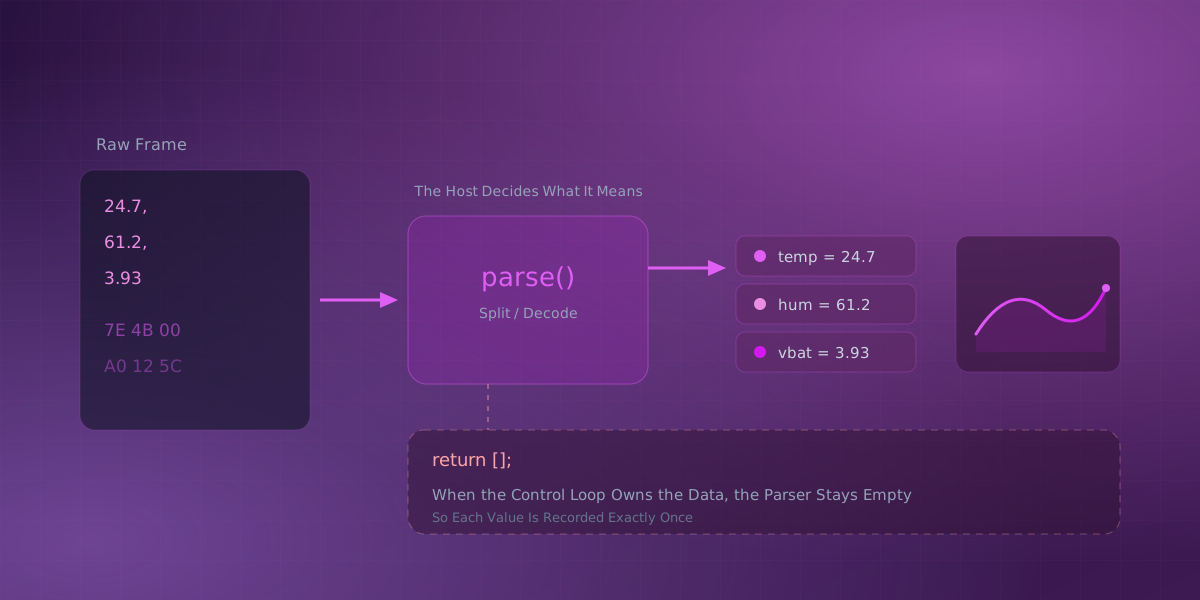
Frame Parsers: How Bytes Become Datasets
Serial Studio is built on one idea: the device sends data, and the host decides what that data means. A frame parser is the small script, or built-in template, that does that deciding: it turns one incoming frame of raw device data into the named values Serial Studio plots. "Deciding what it means" can happen in a few different places, and knowing which one to use is the difference between a dashboard that behaves and one that mysteriously records every value twice. This post walks through the options from simplest to most involved, and explains a case that surprises people: when the frame parser is supposed to be empty on purpose.
5 min read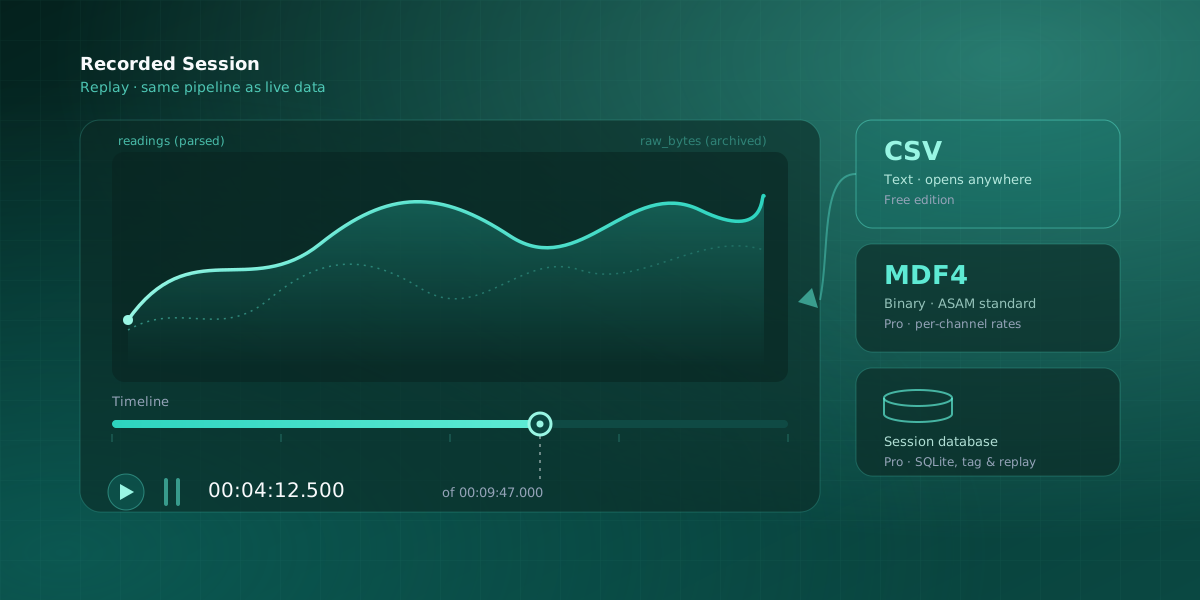
Data Logging and Session Replay in Serial Studio
You cannot watch a dashboard forever. The fault that matters might happen at 3 a.m., during the one test run nobody was staring at the screen for, or three weeks before someone asks "what was the coolant temperature doing right before it failed?" A live view answers questions about right now. Everything else needs a recording.
9 min read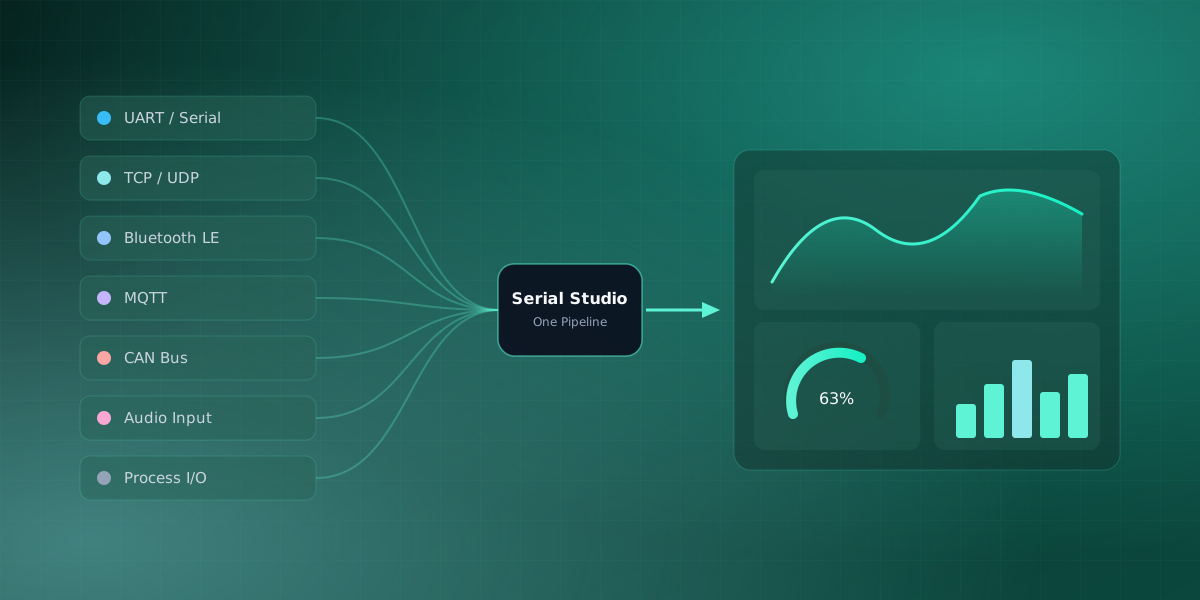
Serial Studio Isn't Just for Serial Ports
The name sets an expectation that the app comfortably exceeds. Serial Studio did begin as a tool for serial ports, and that is still the most common way people use it. But under the hood it is a general real-time data dashboard, and the serial port is only one of fourteen ways to feed it. If you have been reaching for a different tool the moment your data left the USB cable, this is worth two minutes.
5 min read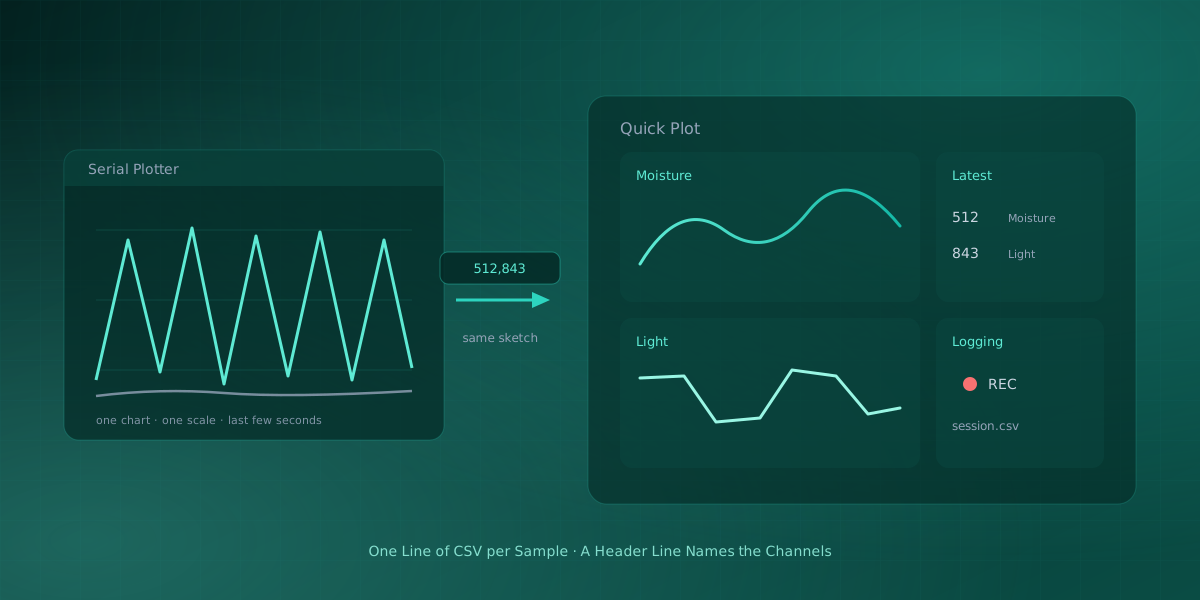
An Arduino Serial Plotter Alternative
The Serial Plotter built into the Arduino IDE is a genuinely useful tool. You print numbers, it draws lines, and for a first look at a sensor it is exactly enough. But most people who use it hit the same wall: the experiment starts working, you want to actually study the data, and the plotter has nothing more to give. This post is about what sits on the other side of that wall, without changing a line of how your sketch prints. The short answer is Serial Studio's free Quick Plot mode, which reads the same one line of CSV and turns it into named plots, gauges, and a recorded session.
6 min read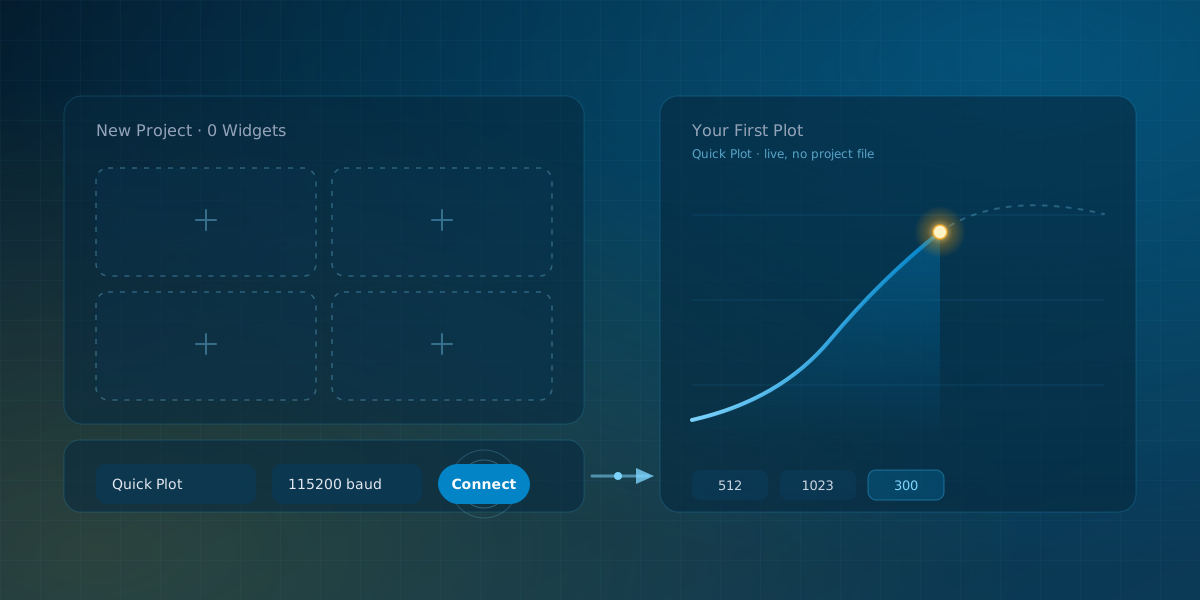
Your First Serial Studio Project: From Zero to a Live Plot
Most posts on this blog assume you already have Serial Studio open, a device wired up, and a project file loaded. This one doesn't. If you've never launched the app before, here's the actual path from a blank install to a live plot on screen, and from there to a real project you can save and reload.
7 min read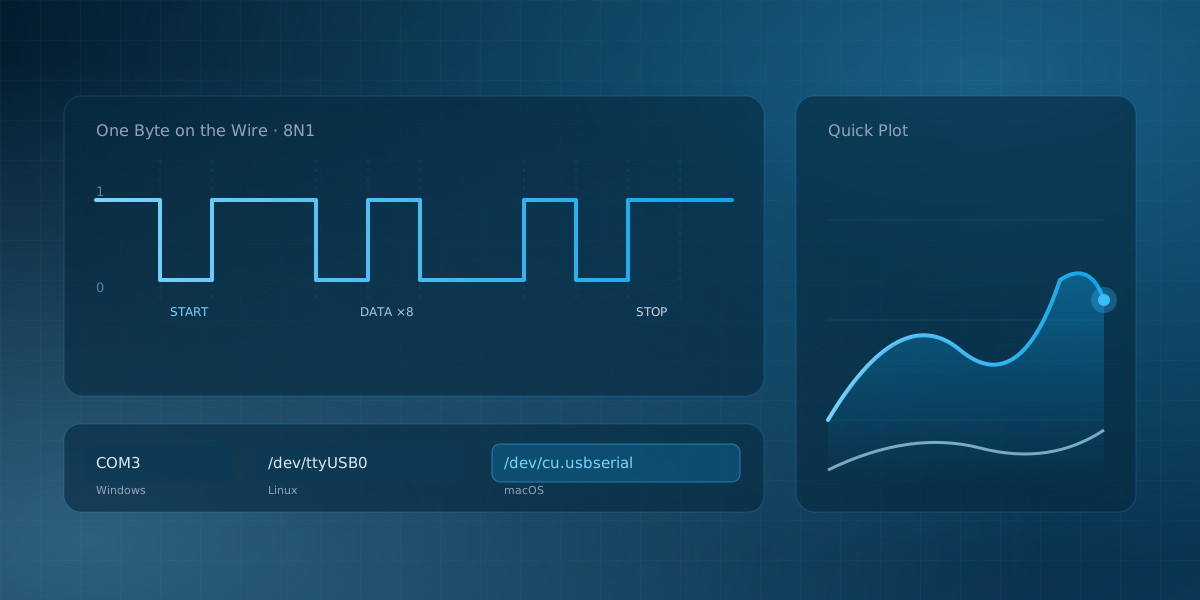
How to Read Data From a Serial Port
Reading a serial port means three things: opening the device your operating system exposes, setting the baud rate to match the sender, and receiving the stream of bytes that arrives. If you have wired up an Arduino, an ESP32, a GPS module, or almost any microcontroller, you have done all three already, probably without thinking much about it. It is worth understanding, because a few minutes on the basics will save you hours of chasing "garbage on the screen" later.
11 min read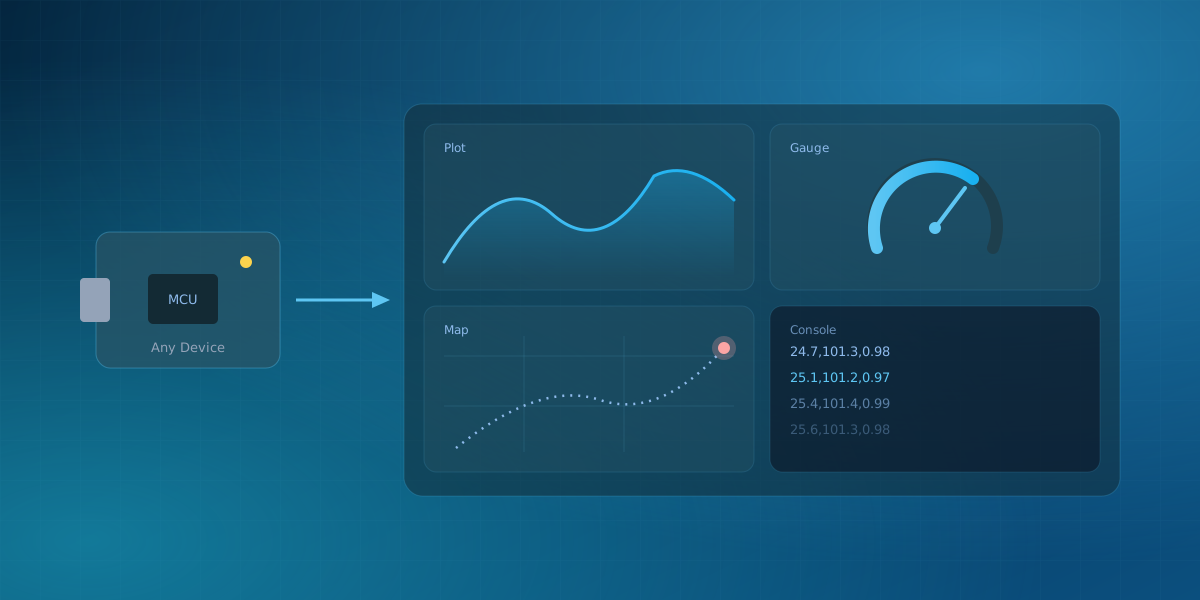
What Is Serial Studio? A Tour of the Dashboard App
When people first hear the name "Serial Studio," they usually picture a serial-port terminal. That is where it started, but it is not what it is now. Serial Studio is a cross-platform desktop application that takes a live stream of data from a device and turns it into a real-time dashboard: plots, gauges, maps, 3D views, and more. This is a short tour of what it does and how the pieces fit together.
5 min read