An Arduino Serial Plotter Alternative
Where the Arduino IDE's Serial Plotter falls short, and how to get named channels, gauges, logging and richer plots from the same one line of CSV.

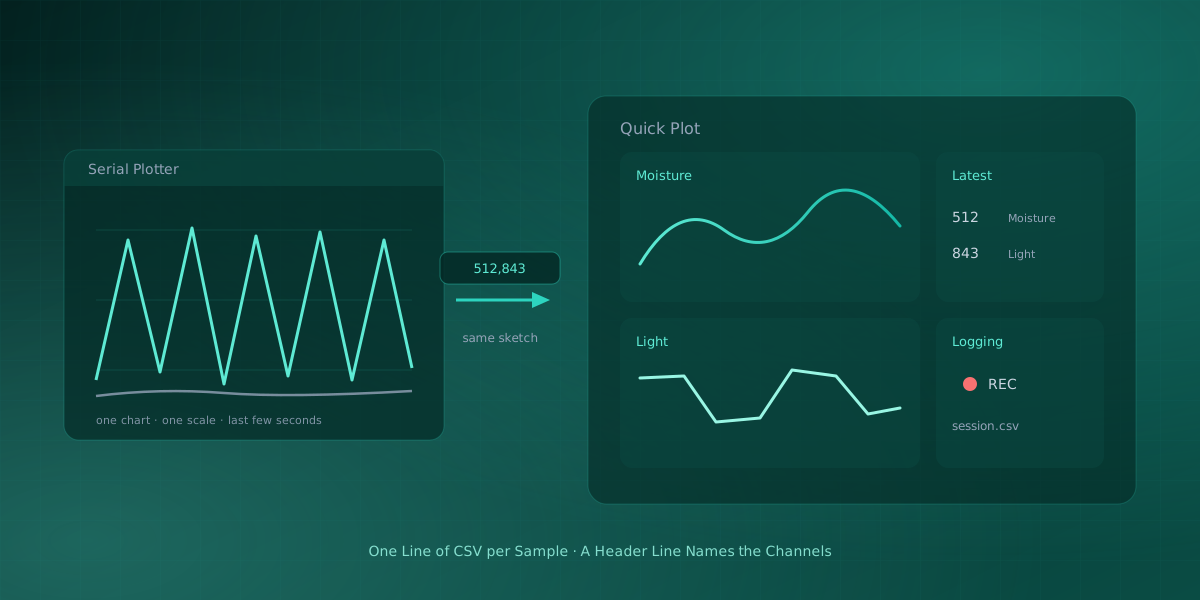
The Serial Plotter built into the Arduino IDE is a genuinely useful tool. You print numbers, it draws lines, and for a first look at a sensor it is exactly enough. But most people who use it hit the same wall: the experiment starts working, you want to actually study the data, and the plotter has nothing more to give. This post is about what sits on the other side of that wall, without changing a line of how your sketch prints. The short answer is Serial Studio's free Quick Plot mode, which reads the same one line of CSV and turns it into named plots, gauges, and a recorded session.
What the Serial Plotter does well
Open Tools → Serial Plotter, print values separated by commas, and every value becomes a trace. It requires no setup, it ships with the IDE, and it answers the first question of any sensor project: is this thing alive and roughly right?
Current IDE releases (2.x) even let you label each value inline: print label:value pairs instead of bare numbers, and the plotter reads the names straight into its legend.
For that job, keep using it. The problem is the second question.
Where it stops
The Serial Plotter is a single small chart with a short rolling window of the most recent samples. Labeling closed one old complaint, but the shape of the tool did not change. In practice, that means:
- Everything shares one chart and one Y axis, named or not. A 0-to-1023 ADC trace still flattens a 0-to-5 voltage trace into a line on the floor, whether you called it
Moisture:512or just printed512. - The window is short and fixed. A slow drift, a rare glitch, or anything older than the last few seconds has already scrolled away.
- Nothing is saved. When you close the window, the data is gone. There is no way to export what you just watched.
- A line is the only shape. No gauge for a level, no bar for a quick comparison, no way to lay out an actual dashboard.
None of this is a criticism of the tool; it is a preview, not an instrument. But "watch the last five seconds of one chart" and "understand what my hardware is doing" are different jobs.
The same output, read by a better tool
The good news is that the plotter's data format, comma-separated values on one line per sample, is exactly what other tools read too. Serial Studio's Quick Plot mode consumes the same one line of CSV per sample directly, using the same sketch:
void setup() {
  Serial.begin(115200);
  Serial.println("Moisture,Light");  // one text-only line names the channels
}

void loop() {
  Serial.print(analogRead(A0));
  Serial.print(',');
  Serial.println(analogRead(A1));
  delay(50);
}
Close the IDE's serial windows (the port is exclusive, only one program can hold it), open Serial Studio, pick the port and baud rate, choose Quick Plot (Comma Separated Values), and connect. Each value gets its own live plot with its own scale, alongside a data grid of the current readings. The steps are the same on Windows, macOS, and Linux.
That first Serial.println("Moisture,Light") line is worth a second look. If the first thing Quick Plot receives is a line with no numbers in it, it treats it as a header and uses the words as channel names, the same way a CSV file names its columns.
Print it once in setup() and your plots are labeled Moisture and Light instead of Channel 1 and Channel 2. Since the header goes out when the board boots, connect first and then press the reset button if you want to be sure it arrives; missing it just means you get the default names.
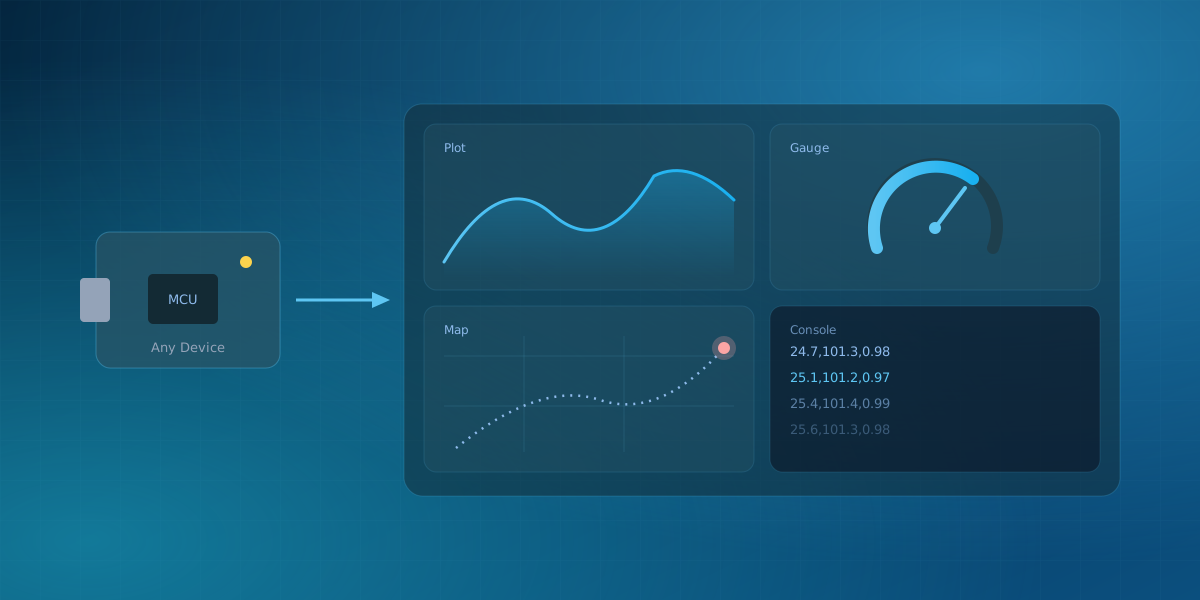
Past that, the differences are the ones the IDE plotter cannot close: the session records to a CSV file you can open in a spreadsheet afterward, the console keeps a scrollback of the raw stream (in hex too, if you need it), and each plot's time window is yours to set instead of fixed. When one shared window stops being enough, the same stream can feed a designed dashboard with gauges, bars, an FFT, or a map, which is what Project File mode is for.
| Serial Plotter | Quick Plot | |
|---|---|---|
| Naming channels | Inline name:value pairs (IDE 2.x) |
A text header line names every column |
| Charts and scales | One shared chart and Y axis | Each value gets its own plot and scale |
| Time window | Short and fixed | Yours to set per plot |
| Keeping the data | Gone when the window closes | Session records to a CSV file |
| Beyond a line | A line is the only shape | Gauges, bars, FFT, maps via a project |
Which tool when
- Thirty-second sanity check, IDE already open? Serial Plotter. It is right there.
- Watching an experiment, comparing channels, keeping the data? A real telemetry tool. Quick Plot is the zero-configuration entry point, and it is part of Serial Studio's free, open-source edition.
The sketch does not care either way. One line of CSV per sample is the lingua franca, and every tool in this story reads it. That holds off the Arduino too: the same header-and-CSV convention works unchanged on an STM32 or a Raspberry Pi Pico.
Frequently asked questions
Why does my sketch work in the Serial Plotter but show nothing elsewhere?
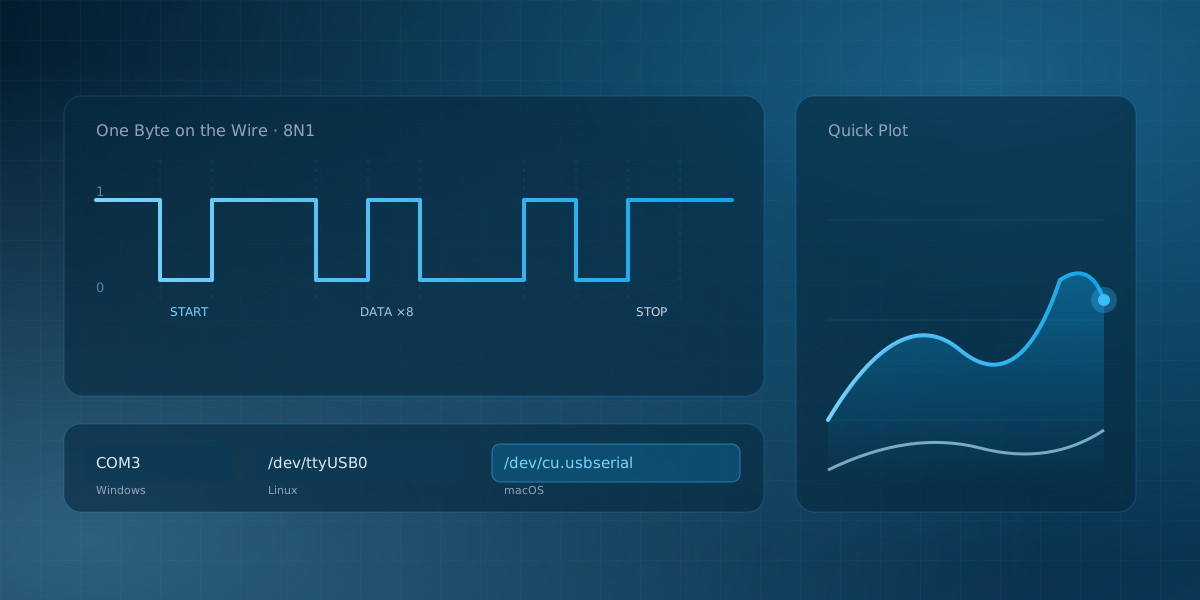
Nearly always the port, not the sketch. Serial ports are exclusive, so the IDE's Serial Monitor or Plotter still being open blocks any other program from opening the same port. Close them first. The second suspect is the baud rate not matching what your sketch passed to Serial.begin().
Can I plot more than one value?
Yes, in both tools. Separate the values with commas and end the sample with println, so each line carries one complete reading of every channel. The IDE's plotter (2.x) can label each one with a name:value pair, but still draws every trace on one shared chart; Quick Plot names channels from a header line and gives each its own plot and scale.
How fast can I print?
At 115200 baud the wire moves roughly 11,500 characters per second, so a 20-character line has headroom into the hundreds of samples per second. The usual mistake is printing with no delay at all, which floods the buffer and stalls the loop. Decide what rate the measurement actually needs and print at that rate.
Do I have to change my firmware to switch tools?
No. If your sketch already prints comma-separated values for the Serial Plotter, it works in Serial Studio unchanged. The only addition worth making is the one-line text header in setup() to name your channels.
Comments