Draw a Custom Dashboard Widget With Canvas2D
When no built-in widget fits, a paint(ctx, w, h) script can draw anything: the Canvas2D drawing model, theme palette, and live dataset access explained.

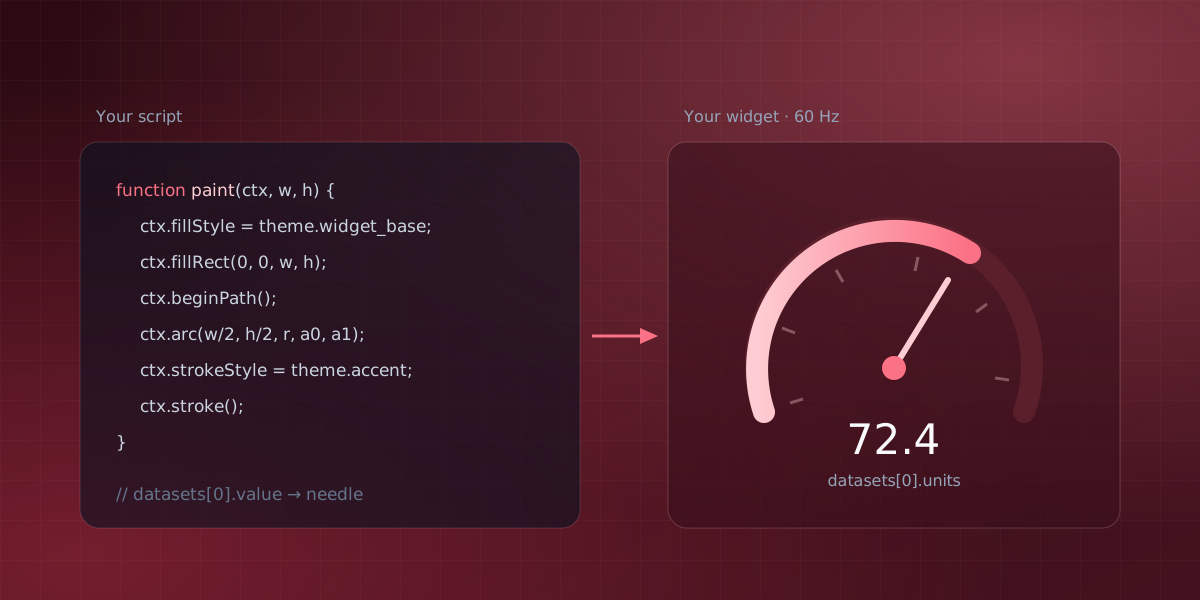
Dashboards are built from a vocabulary of standard widgets: plots, gauges, bars, compasses, LED panels. When none of them fit, the escape hatch is the Painter widget, part of Serial Studio Pro: a blank canvas that runs a drawing script you write. Serial Studio ships more than twenty prefab widgets, and most instruments you will ever need are in that set. But every so often the right visualization for your data simply does not exist as one: a seven-segment readout, a polar plot, an attitude indicator drawn your way. If you have ever drawn on a <canvas> element in a browser, you already know how to use the Painter.
Immediate mode: redraw everything, every time
The Painter follows the Canvas2D model, which is immediate mode: nothing you draw persists. The widget calls your paint function at the refresh rate (60 Hz by default, configurable from 1 to 240), hands it a drawing context and the current width and height, and expects the function to redraw the entire widget from scratch:
function paint(ctx, w, h) {
  ctx.fillStyle = theme.widget_base;
  ctx.fillRect(0, 0, w, h);

  if (datasets.length === 0) return;

  const ds = datasets[0];
  const frac = (ds.value - ds.min) / (ds.max - ds.min || 1);

  ctx.fillStyle = theme.accent;
  ctx.fillRect(16, h - 24, (w - 32) * frac, 8);

  ctx.font = "16px monospace";
  ctx.fillStyle = theme.widget_text;
  ctx.fillText(ds.value.toFixed(2) + " " + ds.units, 16, 24);
}
That is a complete widget: a horizontal bar with a numeric readout. The two guards are earning their keep, not padding the example: a freshly added widget has no datasets bound yet, so datasets[0] would be undefined on the first paint, and a dataset whose min equals its max would otherwise divide by zero.
The ctx object exposes the familiar Canvas2D surface, fillRect, beginPath, moveTo, lineTo, arc, stroke, fillText, fill and stroke styles, fonts, and text alignment, mapped onto the application's native renderer.
Redrawing everything at 60 Hz sounds wasteful and is not; simple vector drawing is far below what the renderer can do, and immediate mode is why the code stays this short. There is no scene graph to update, no invalidation logic, no state to keep consistent. The current data comes in, the picture goes out.
Data in, state on the side
Inside the script, datasets is an array of the datasets bound to the widget, each carrying value, min, max, title, and units, so one script scales to however many channels you attach. Drawing wants the current value, but some visuals also need memory: a peak-hold marker, a decaying trail, a scrolling history. For that there is a second, optional hook, onFrame(), which runs when a new frame of data arrives (with timing available via frame.timestampMs, the same arrival-time-versus-measurement-time distinction that plot X axes deal with). The clean division of labor is the one the bundled scripts use: onFrame updates state in top-level variables, paint only reads them and draws.
When the data comes faster than the frames
The two-hook design is not just tidy, it is the widget's performance model, and it starts mattering the moment a device streams faster than a screen refreshes. Both hooks are driven by the dashboard tick, not by the raw data rate: the dashboard runs at a fixed refresh rate (60 Hz by default, configurable from 1 to 240 Hz), and when data arrives faster than that, the incoming frames are batched. onFrame runs at most once per data-bearing tick and is handed the latest values; paint runs on every tick, including the UI-refresh ticks that carry no new data, and only reads that state and draws. When 200 frames arrive per second and the dashboard ticks at 60, your widget sees the newest value about 60 times a second, not 200: the frames in between collapse into the batch. That is the default, and it is what keeps a burst of data from ever queuing up behind the screen. But the model only holds if each hook respects its budget, and each has a different one.
onFrame runs on the data-bearing ticks, so it must be cheap in a way that does not grow with history. Append into a fixed-size ring buffer and update a running peak; never re-sort, re-scan, or rebuild an array per tick. Because it fires at most once per tick and sees only the latest value, a Painter widget records the signal at the dashboard's tick rate, not the device's full sample rate; if you need every individual sample, do that work upstream in a frame parser or dataset transform, before the value reaches the widget.
paint is on the display clock, where 60 Hz allows about 16 milliseconds, and two habits consume most paint budgets. The first is per-point arithmetic: mapping every sample to pixels with its own division re-derives the same scale hundreds of times, so compute sx and sy once per paint and multiply. The second is per-segment path work: a trace drawn as one beginPath, a loop of lineTo, and a single stroke costs a fraction of stroking each segment individually. And before either, decimate: a widget 400 pixels wide cannot display more than 400 columns, so drawing a 20,000-sample history point by point is 98 percent wasted work. Keeping the minimum and maximum per pixel column and drawing that envelope is how oscilloscopes have handled the same problem for decades, and it preserves exactly the feature decimation usually destroys, the narrow spike.
// paint: one pass, precomputed scale, min/max per pixel column
if (history.length === 0) return;
const sx = history.length / w, sy = h / (maxV - minV || 1);
ctx.beginPath();
for (let px = 0; px < w; px++) {
  let lo = Infinity, hi = -Infinity;
  for (let i = px * sx; i < (px + 1) * sx; i++) {
    const v = history[i | 0];
    if (v < lo) lo = v;
    if (v > hi) hi = v;
  }
  ctx.moveTo(px, h - (hi - minV) * sy);
  ctx.lineTo(px, h - (lo - minV) * sy);
}
ctx.stroke();
The refresh rate itself is the remaining lever. It is configurable from 1 to 240 Hz per widget, and the default 60 is a choice, not a law: a battery gauge is perfectly served at 5 Hz, and dropping it releases the budget for the widgets that move. The watchdog described below is the backstop, but a widget that needs the backstop is a widget with one of these three habits left unfixed.
Laid out end to end, the lifecycle runs from the arriving frame to the pixels on screen: a new data frame triggers onFrame, which updates state in top-level variables that survive between calls; on each refresh-rate tick (60 Hz by default, 1 to 240 configurable) the dashboard invokes paint, which reads that persisted state, issues the Canvas2D drawing calls such as fillRect, arc, stroke, and fillText, and hands the result to the dashboard to composite. A paint that has not returned after 250 ms is cut off by the watchdog.
onFrame and paint run on their own clocks and only meet through the state in between; the watchdog sits off to the side, watching paint rather than the data.
Match the theme instead of fighting it
Hardcoded colors look right in one theme and wrong in the other. The script therefore gets a theme object with the active palette: widget_base, alternate_base, widget_border, widget_text, widget_highlight, accent, alarm, placeholder_text. Route every color through it, as the example above does, and your widget follows light mode, dark mode, and any custom theme without a line of per-theme code.
Sharp edges worth knowing
Two practical notes save the most debugging time. First, ctx.arc maps to the native renderer's arc-path primitive, which means a partial arc should be preceded by a moveTo to the arc's start point. Otherwise the path connects from wherever it was, and you get a chord you did not ask for. The bundled dial gauge script documents this trick in place. Second, the widget guards itself against runaway scripts: a paint call that has not returned after 250 milliseconds is terminated, and consistently slow paints (over 30 ms) earn a warning first. An infinite loop in your drawing code costs you one widget, not the dashboard, and the incoming data stream never stops behind it.
Start from a template, not from zero
The fastest route is to open one of the eighteen bundled painter templates and bend it toward what you need. The set is a tour of what the API can do: an oscilloscope, a radar sweep with afterglow, an artificial horizon, a heatmap, a segmented VU meter with peak hold, a seven-segment display, a polar plot, an XY scope with a Lissajous mode, sparkline grids, status grids, progress rings. Each is a single readable file built on the same two hooks described here.
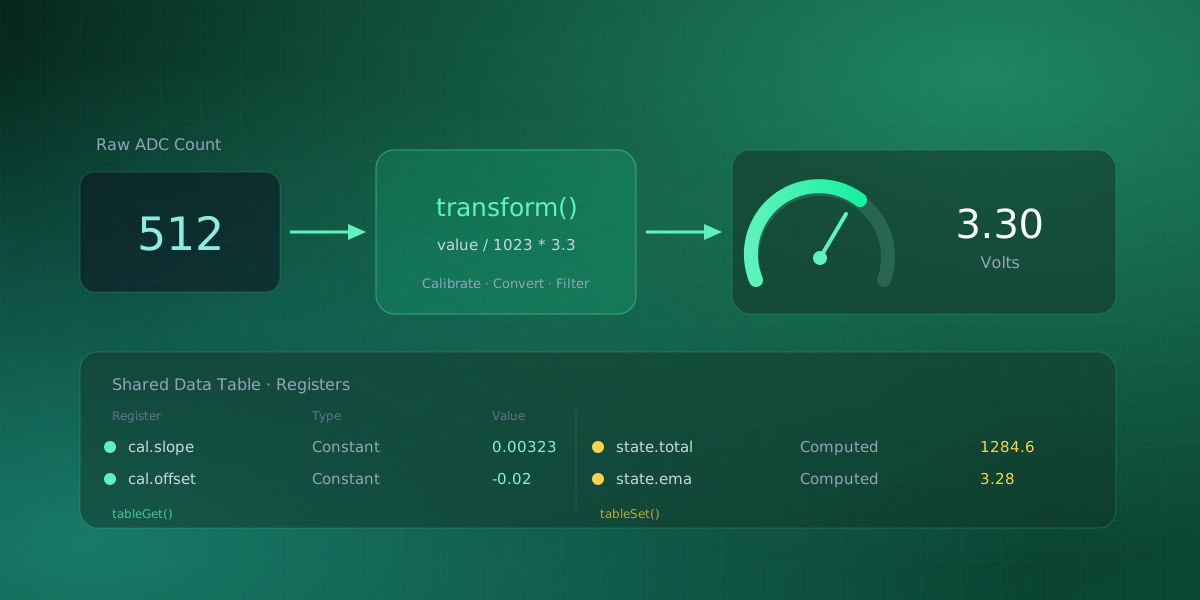
The Painter reference documents the full context API and the template gallery; if your custom widget needs calibrated values rather than raw ones, dataset transforms happen upstream of the widget, so the values arriving in datasets are already the real units.
Comments