A live dashboard for any device.
Connect a microcontroller, instrument or industrial bus. Describe your data once. Serial Studio draws the plots, gauges, maps and 3D views around it, records every frame, and sends commands back.
See everything it doesRuns on Windows, macOS, Linux and Raspberry Pi. Open source on GitHub.
Trusted by
Connect to anything
Choose the transport your device uses. Each driver opens to its documentation and example projects.
UART / Serial
USB-UART, RS-232, RS-485 and TTL. Works with Arduino, ESP32, STM32 and most hobby and industrial boards.
Driver docsNetwork (TCP / UDP)
Open a TCP or UDP socket. Read unicast, broadcast or multicast streams from any host on the network.
Driver docsBluetooth LE
Scan GATT peripherals, subscribe to notifications and stream sensor data wirelessly.
Driver docsMQTT
Publish from hardware and subscribe from anywhere. Bridge Serial Studio into your IoT broker.
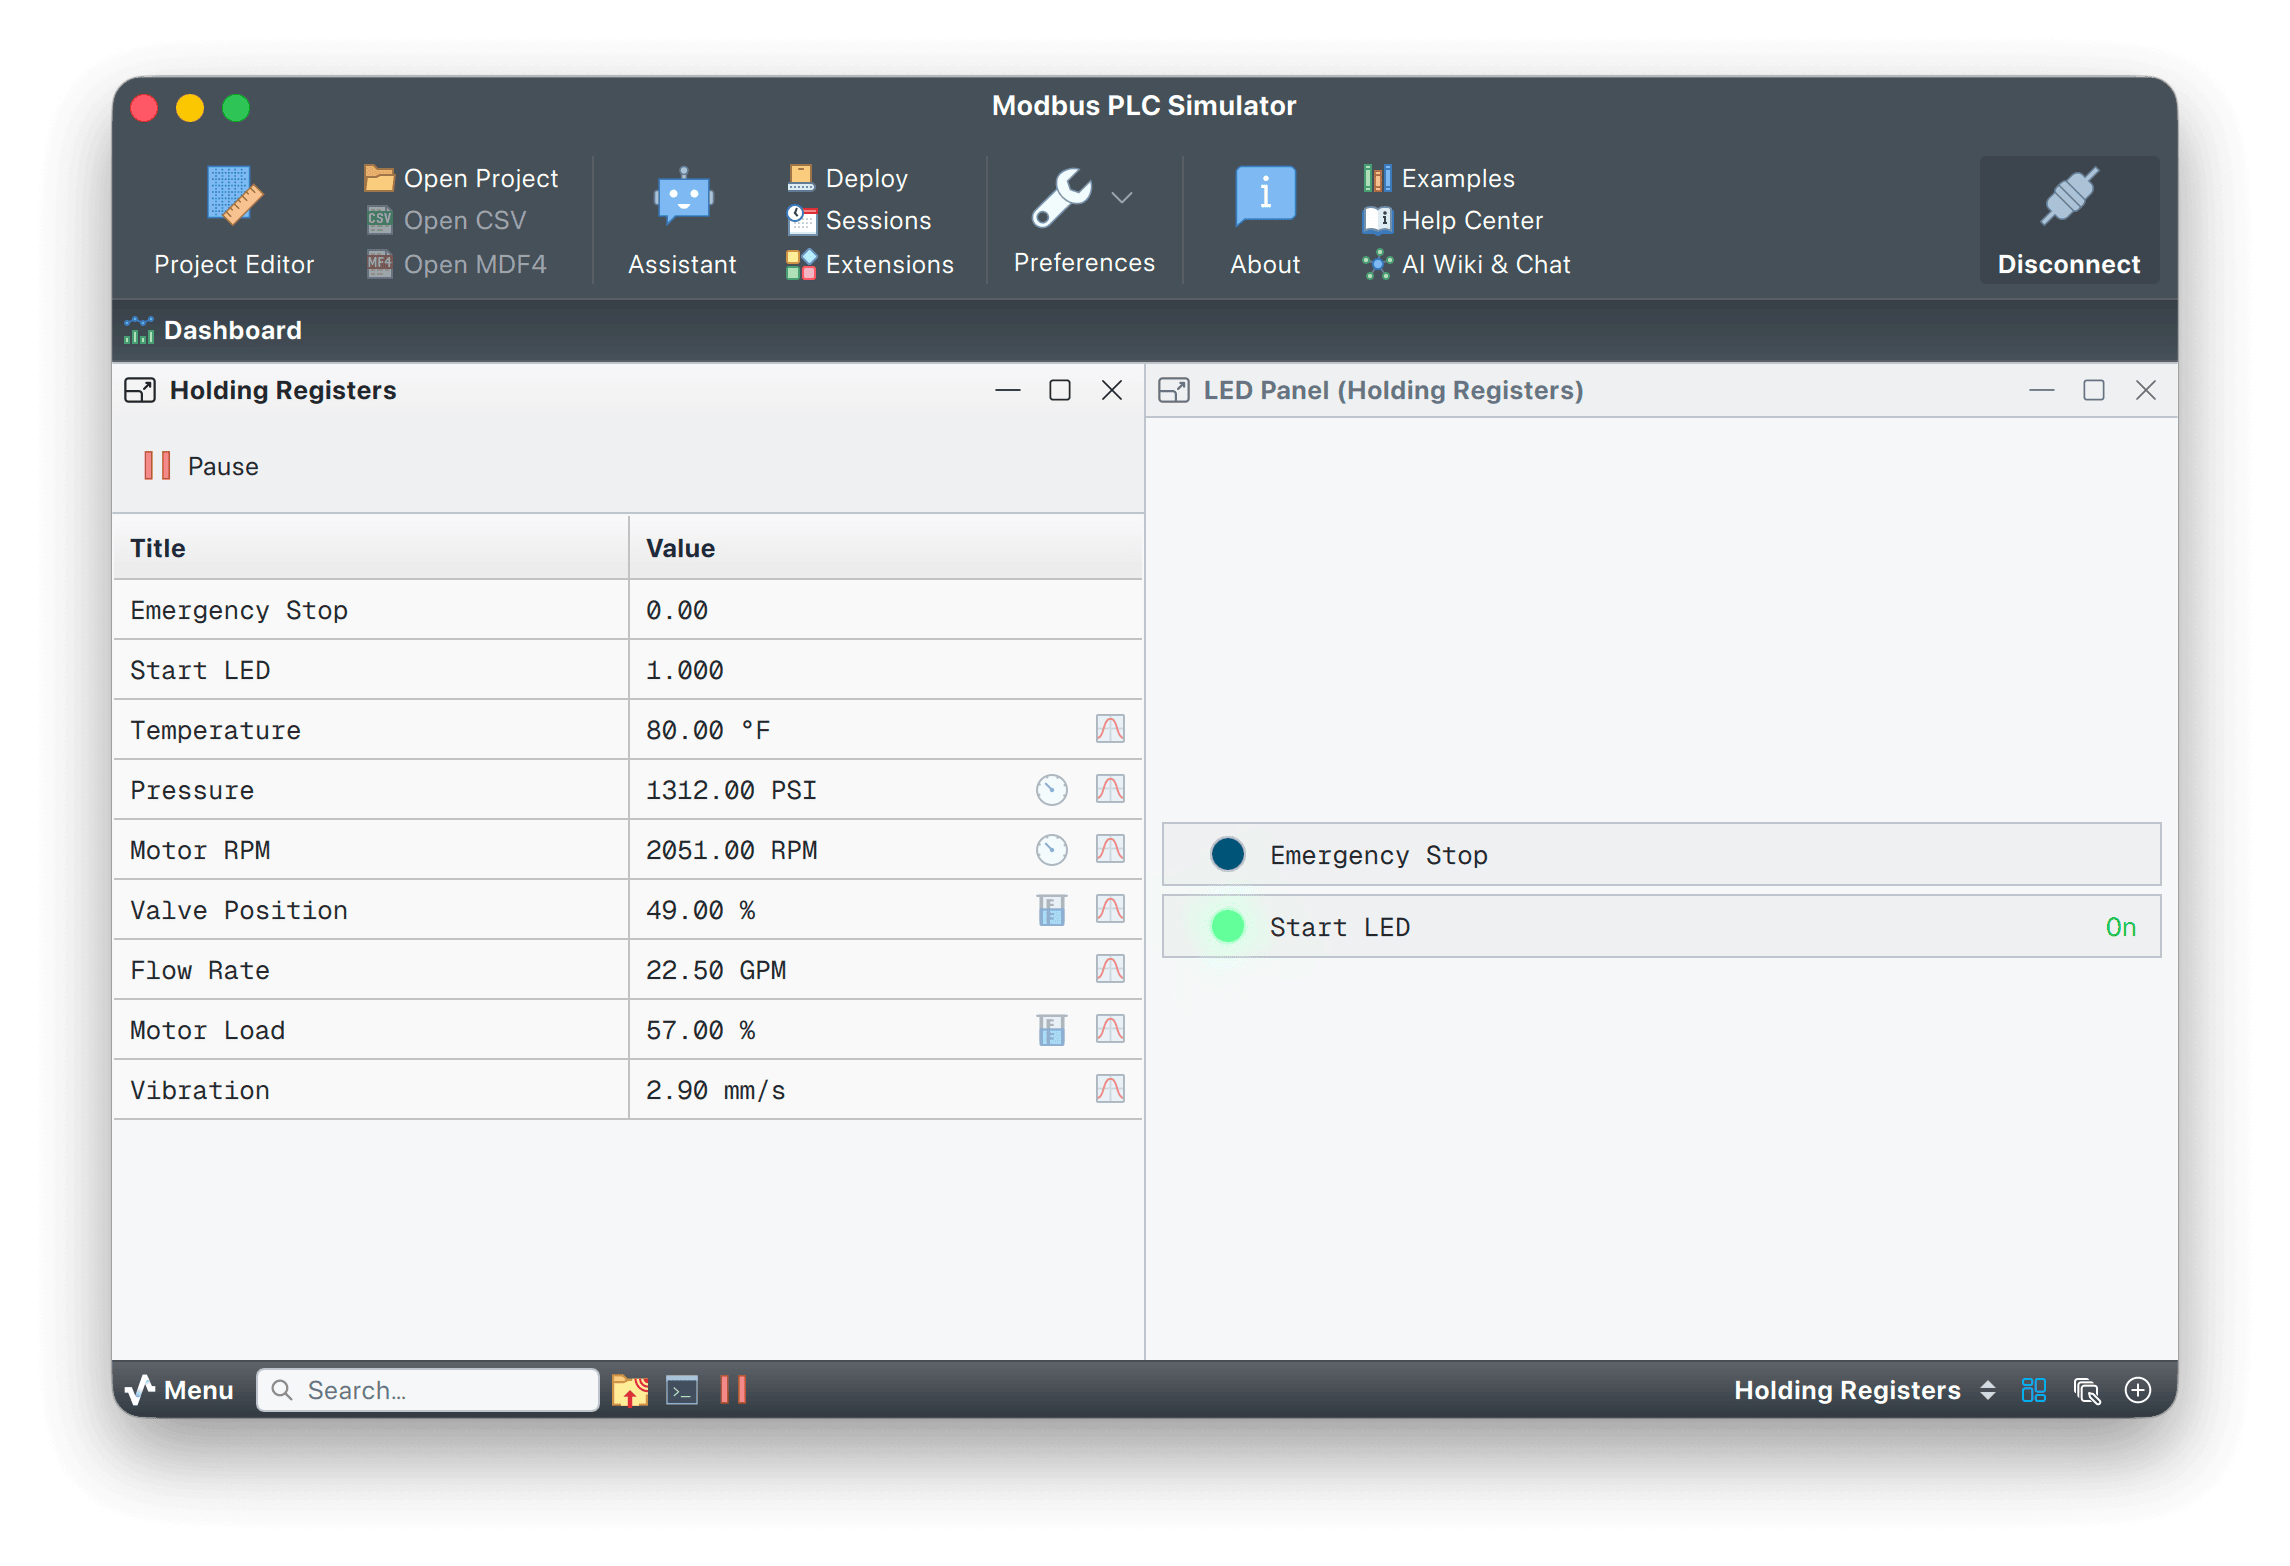
Driver docsModbus TCP / RTU
Poll holding, input, coil and discrete registers. Import vendor CSV, XML or JSON register maps.
Driver docsCAN Bus
Decode classic CAN and CAN FD with DBC import. Built for automotive, robotics and industrial work.
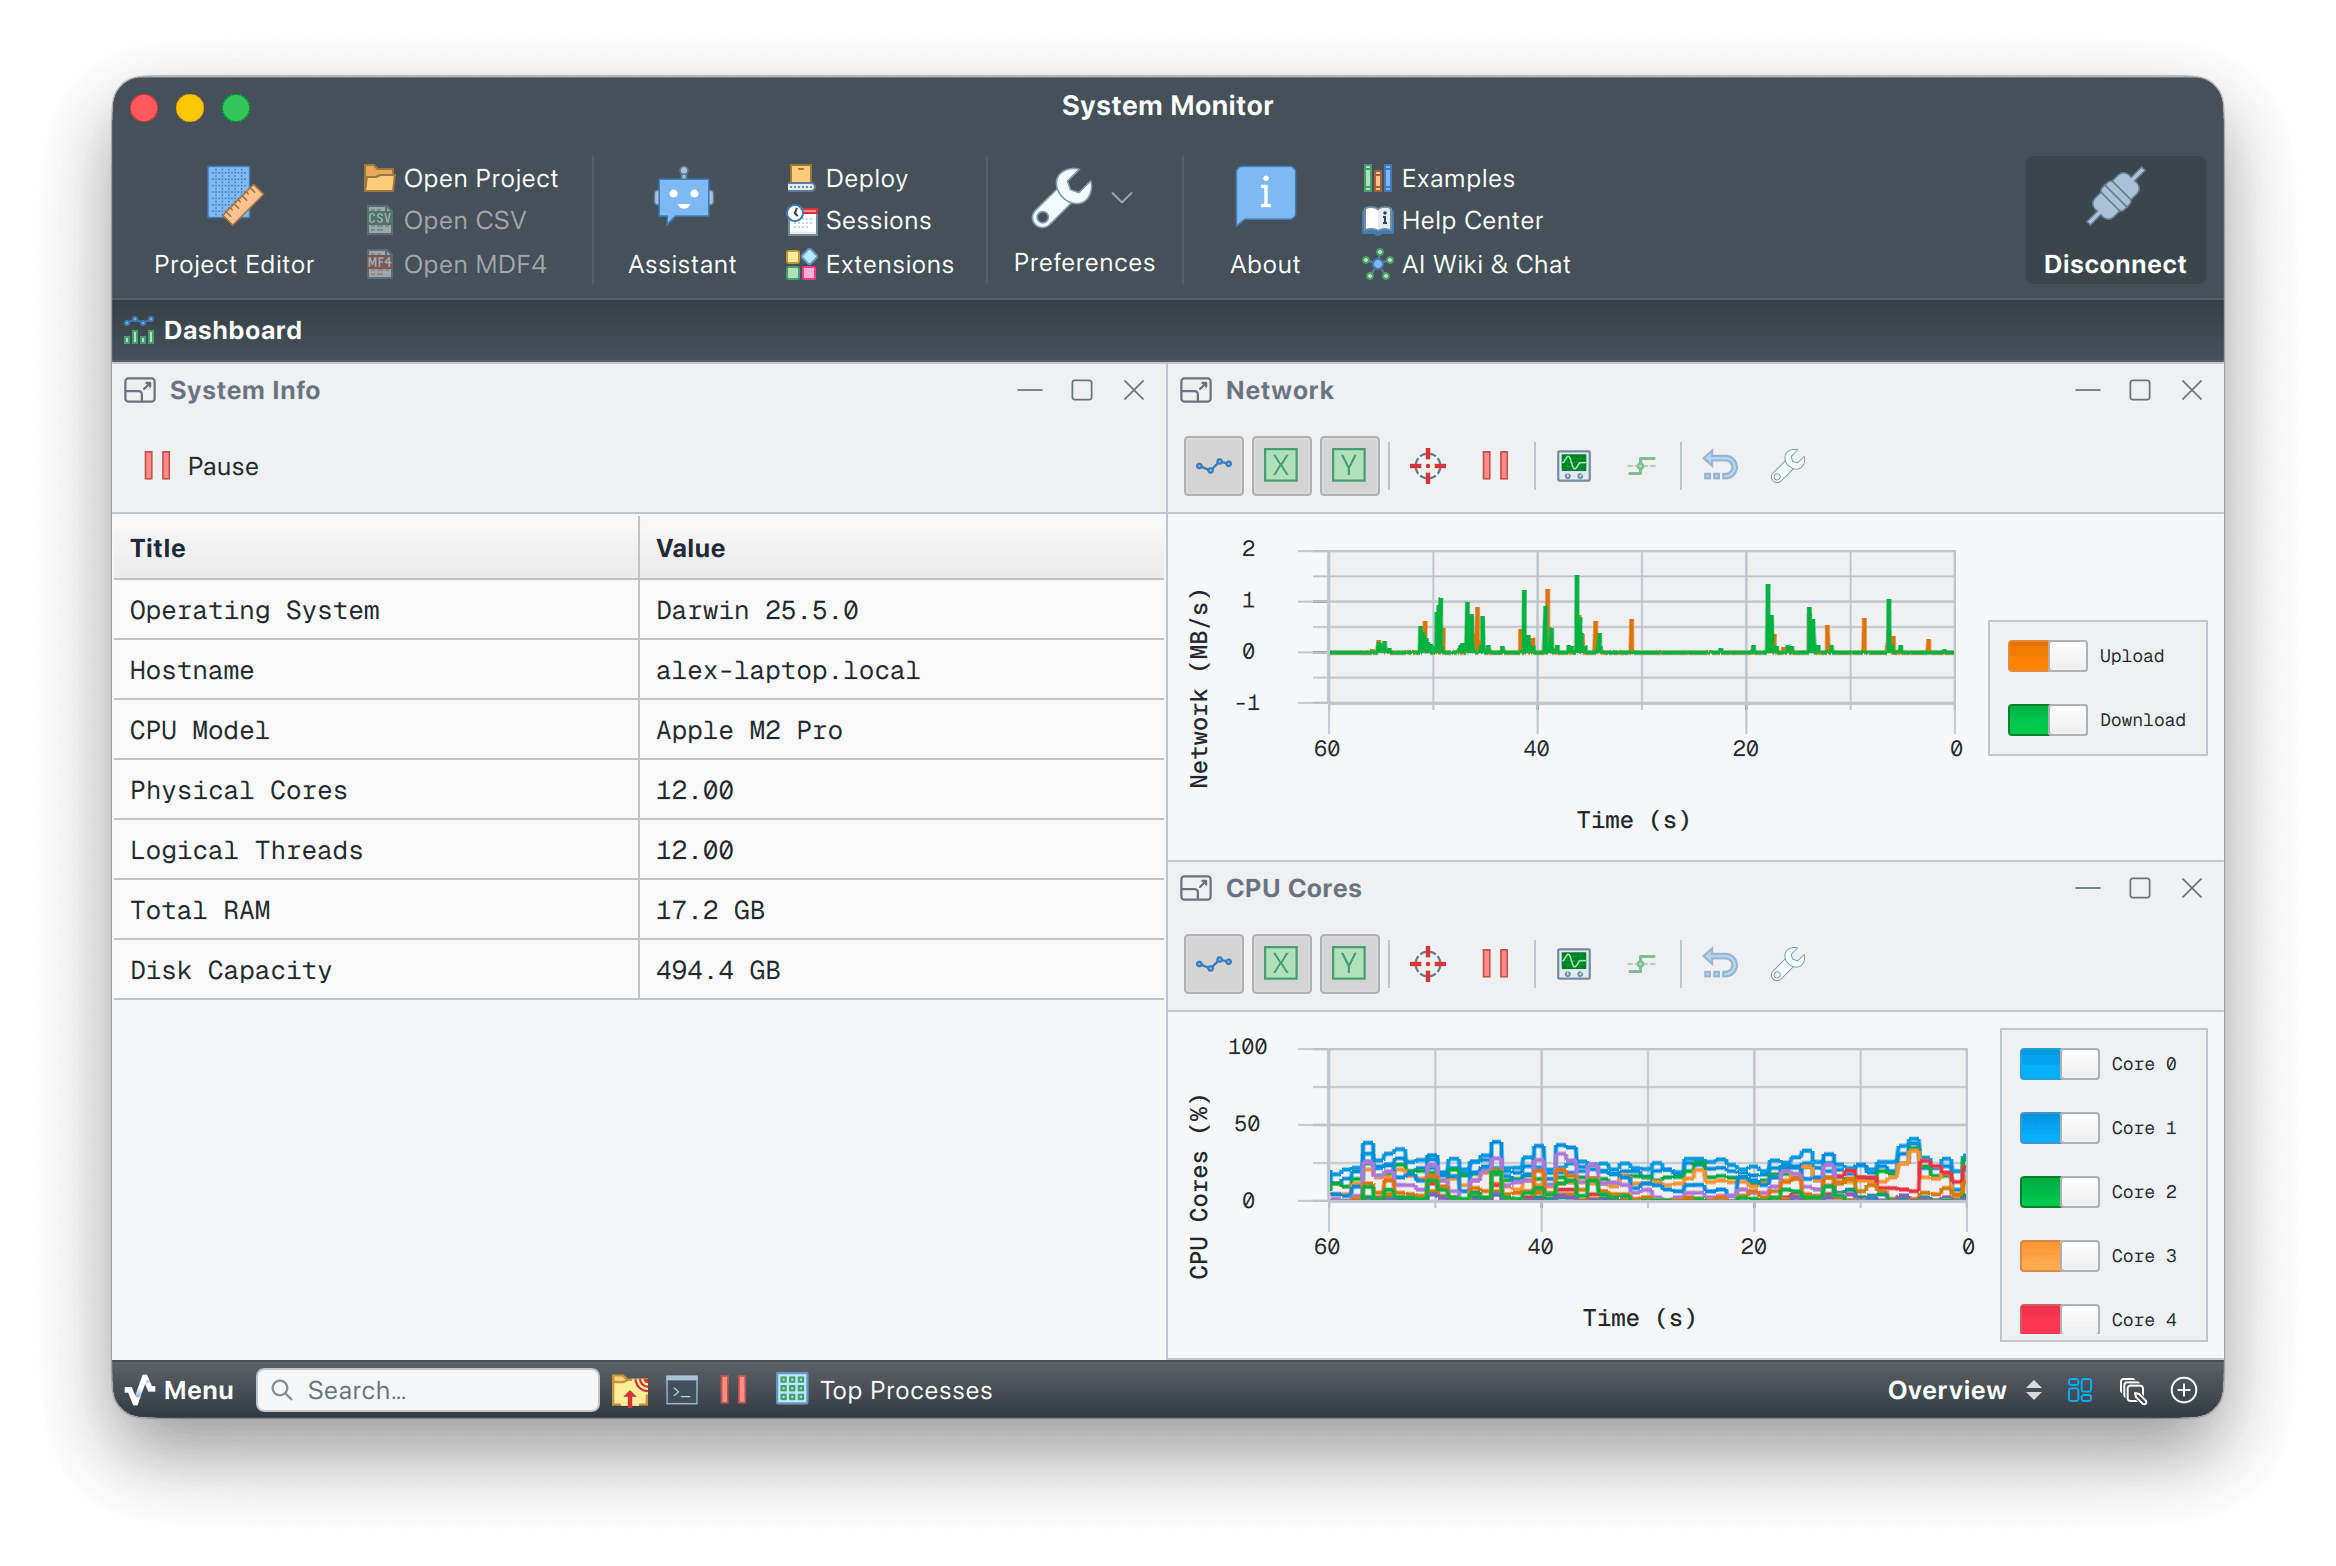
Driver docsAudio Input
Turn any sound card into a multichannel oscilloscope, FFT analyzer or waterfall display.
Driver docsRaw USB (libusb)
Bulk and isochronous endpoints with vendor-specific protocols. Talk to devices that aren't CDC.
Driver docsUSB HID
Gamepads, joysticks and custom HID devices. Decode any report descriptor through hidapi.
Driver docsProcess I/O
Spawn a script and pipe its stdout, or read from a named pipe. Connect Python, Rust or anything.
Driver docsSix stages, one pipeline
Every supported device flows through the same six stages, from raw bytes to a live dashboard. Read the full pipeline reference.
-
Step 01
Connect
The driver receives raw bytes from your device over UART, BLE, TCP/UDP, MQTT, Modbus, CAN, audio, USB, HID or Process I/O.
-
Step 02
Detect frames
The Frame Reader finds each frame in the stream, with optional CRC validation to catch corrupted data.
-
Step 03
Parse frames
Quick Plot splits CSV automatically. For binary protocols, your JavaScript or Lua
parse()turns bytes into datasets. -
Step 04
Populate widgets
Dataset values flow into plots, gauges, GPS maps, 3D views and every other widget on the dashboard.
-
Step 05
Record
In parallel, every frame is written to CSV, MDF4 or a SQLite session database. Recording never slows the live view.
-
Step 06
Replay & export
Open any recording back through the same dashboard. Export an HTML or PDF session report when it's ready to share.
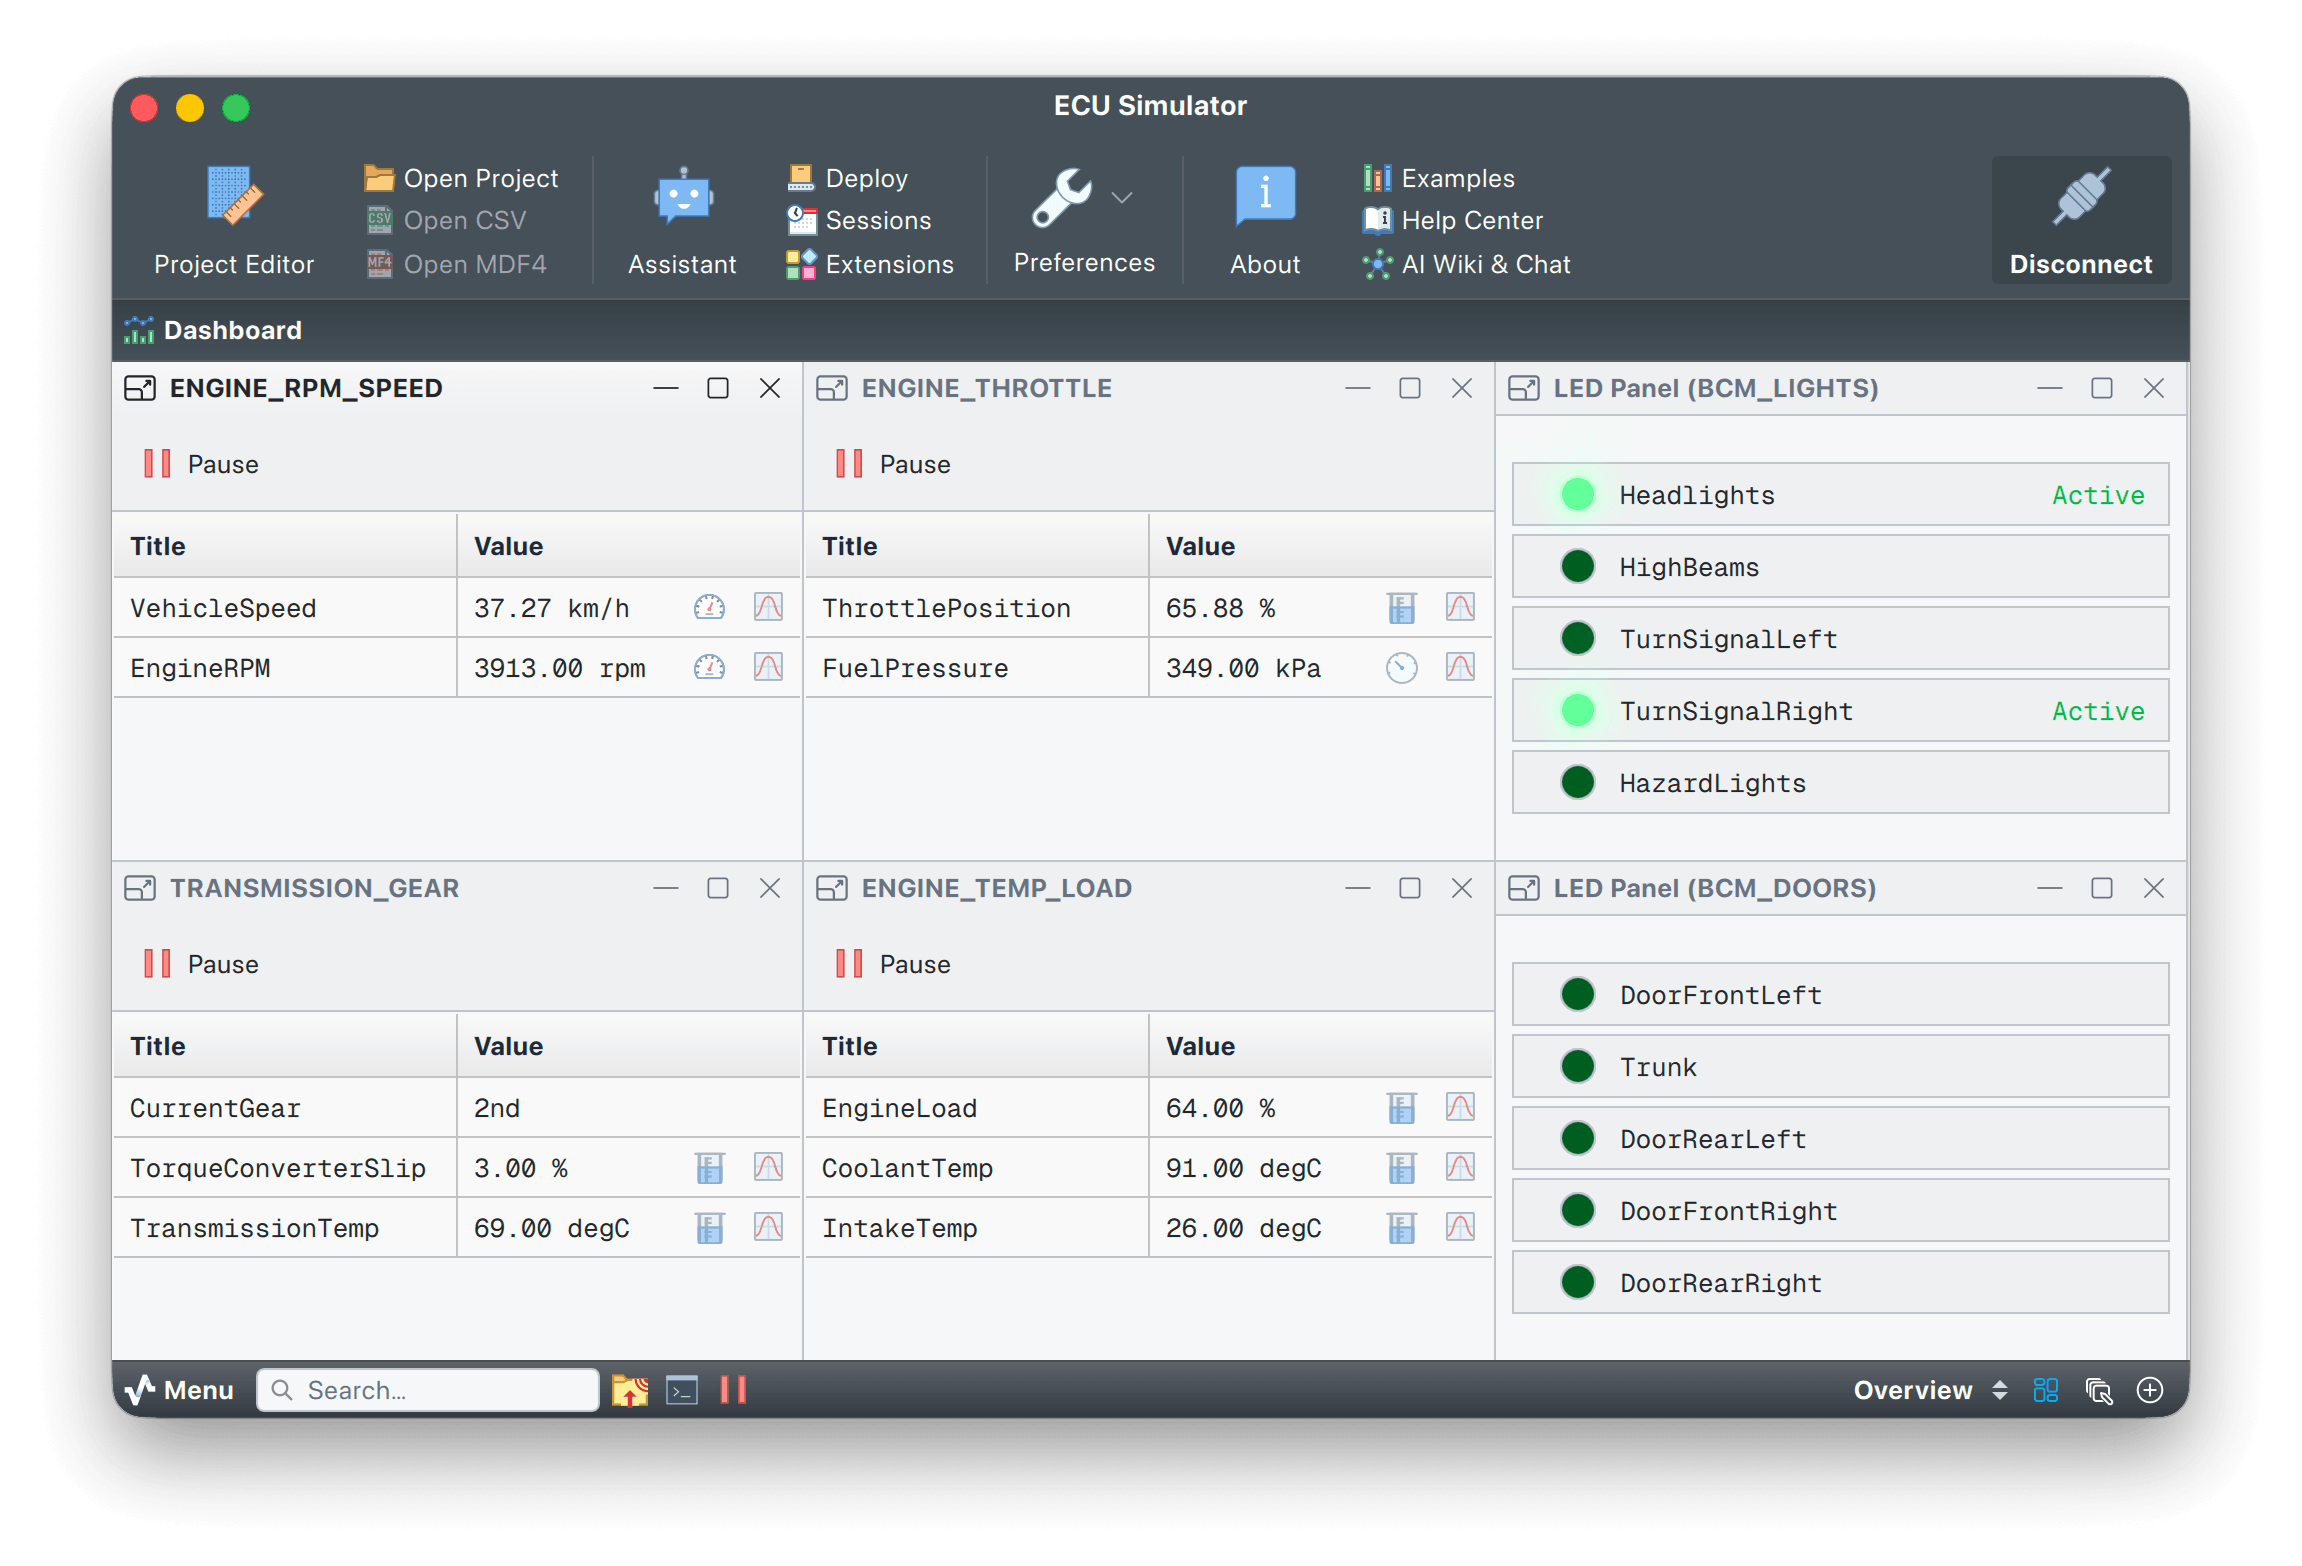
From hobby benches to factory floors
One project file, one binary, one set of widgets. Different shape of data on every screen.
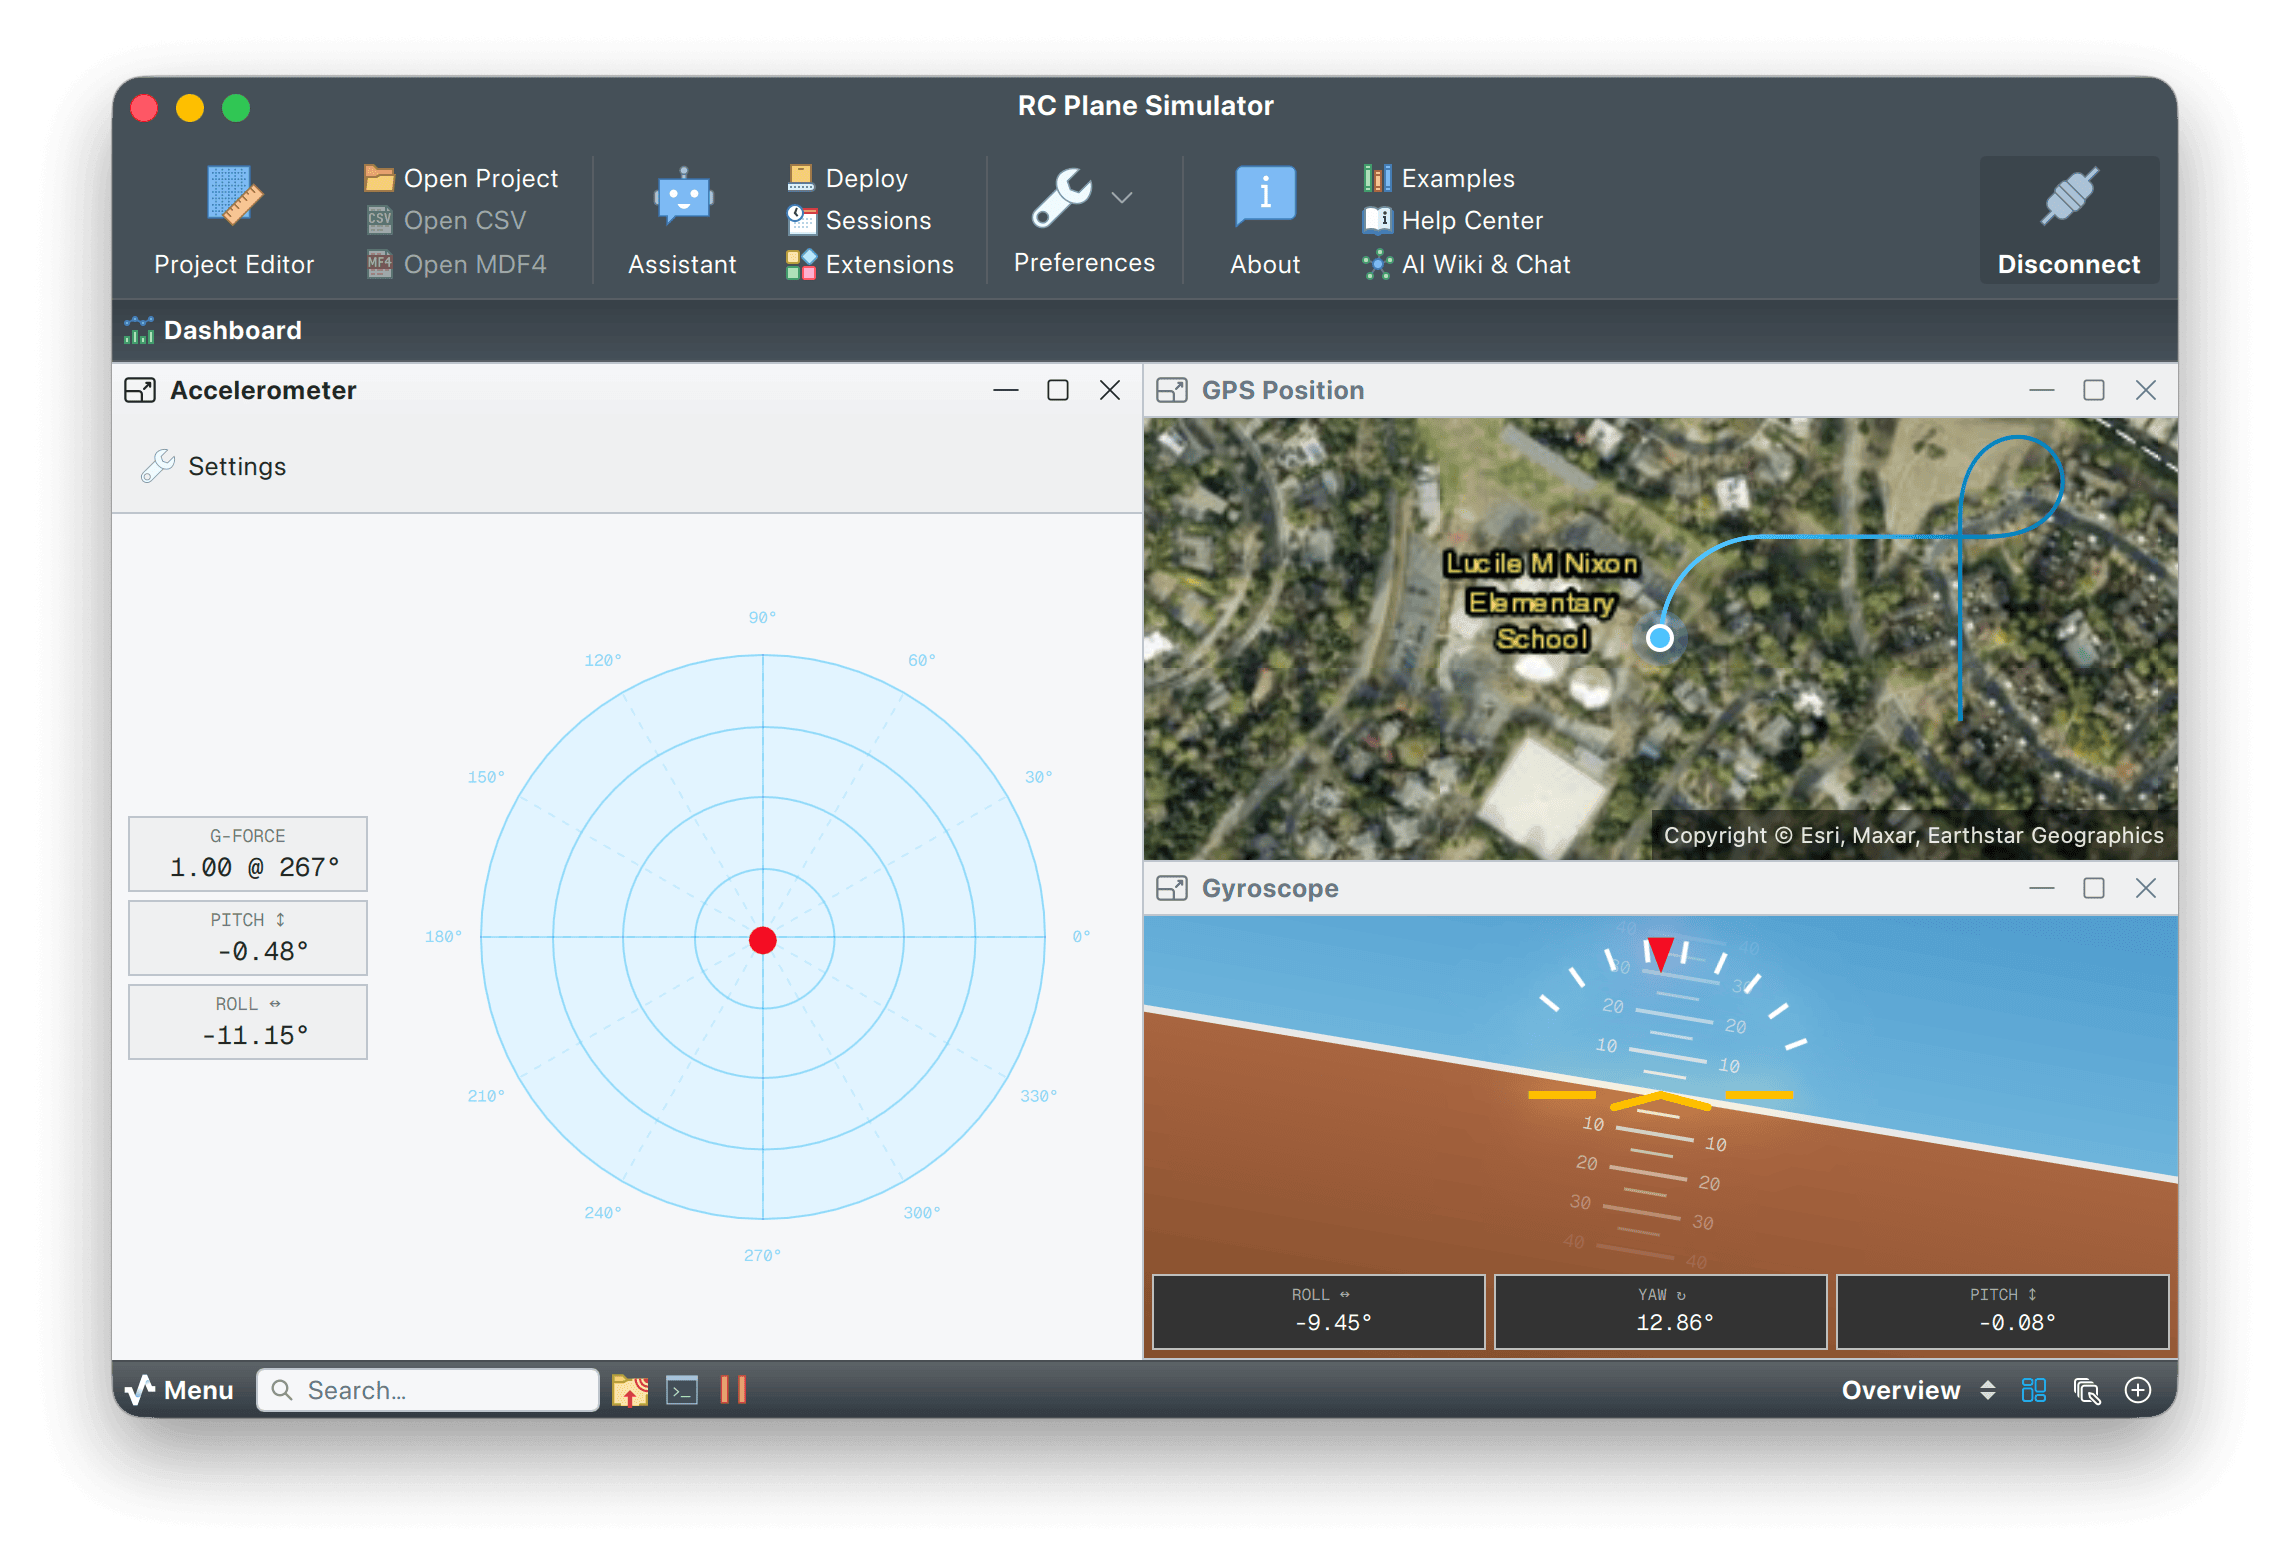
Tune PID loops without writing a UI
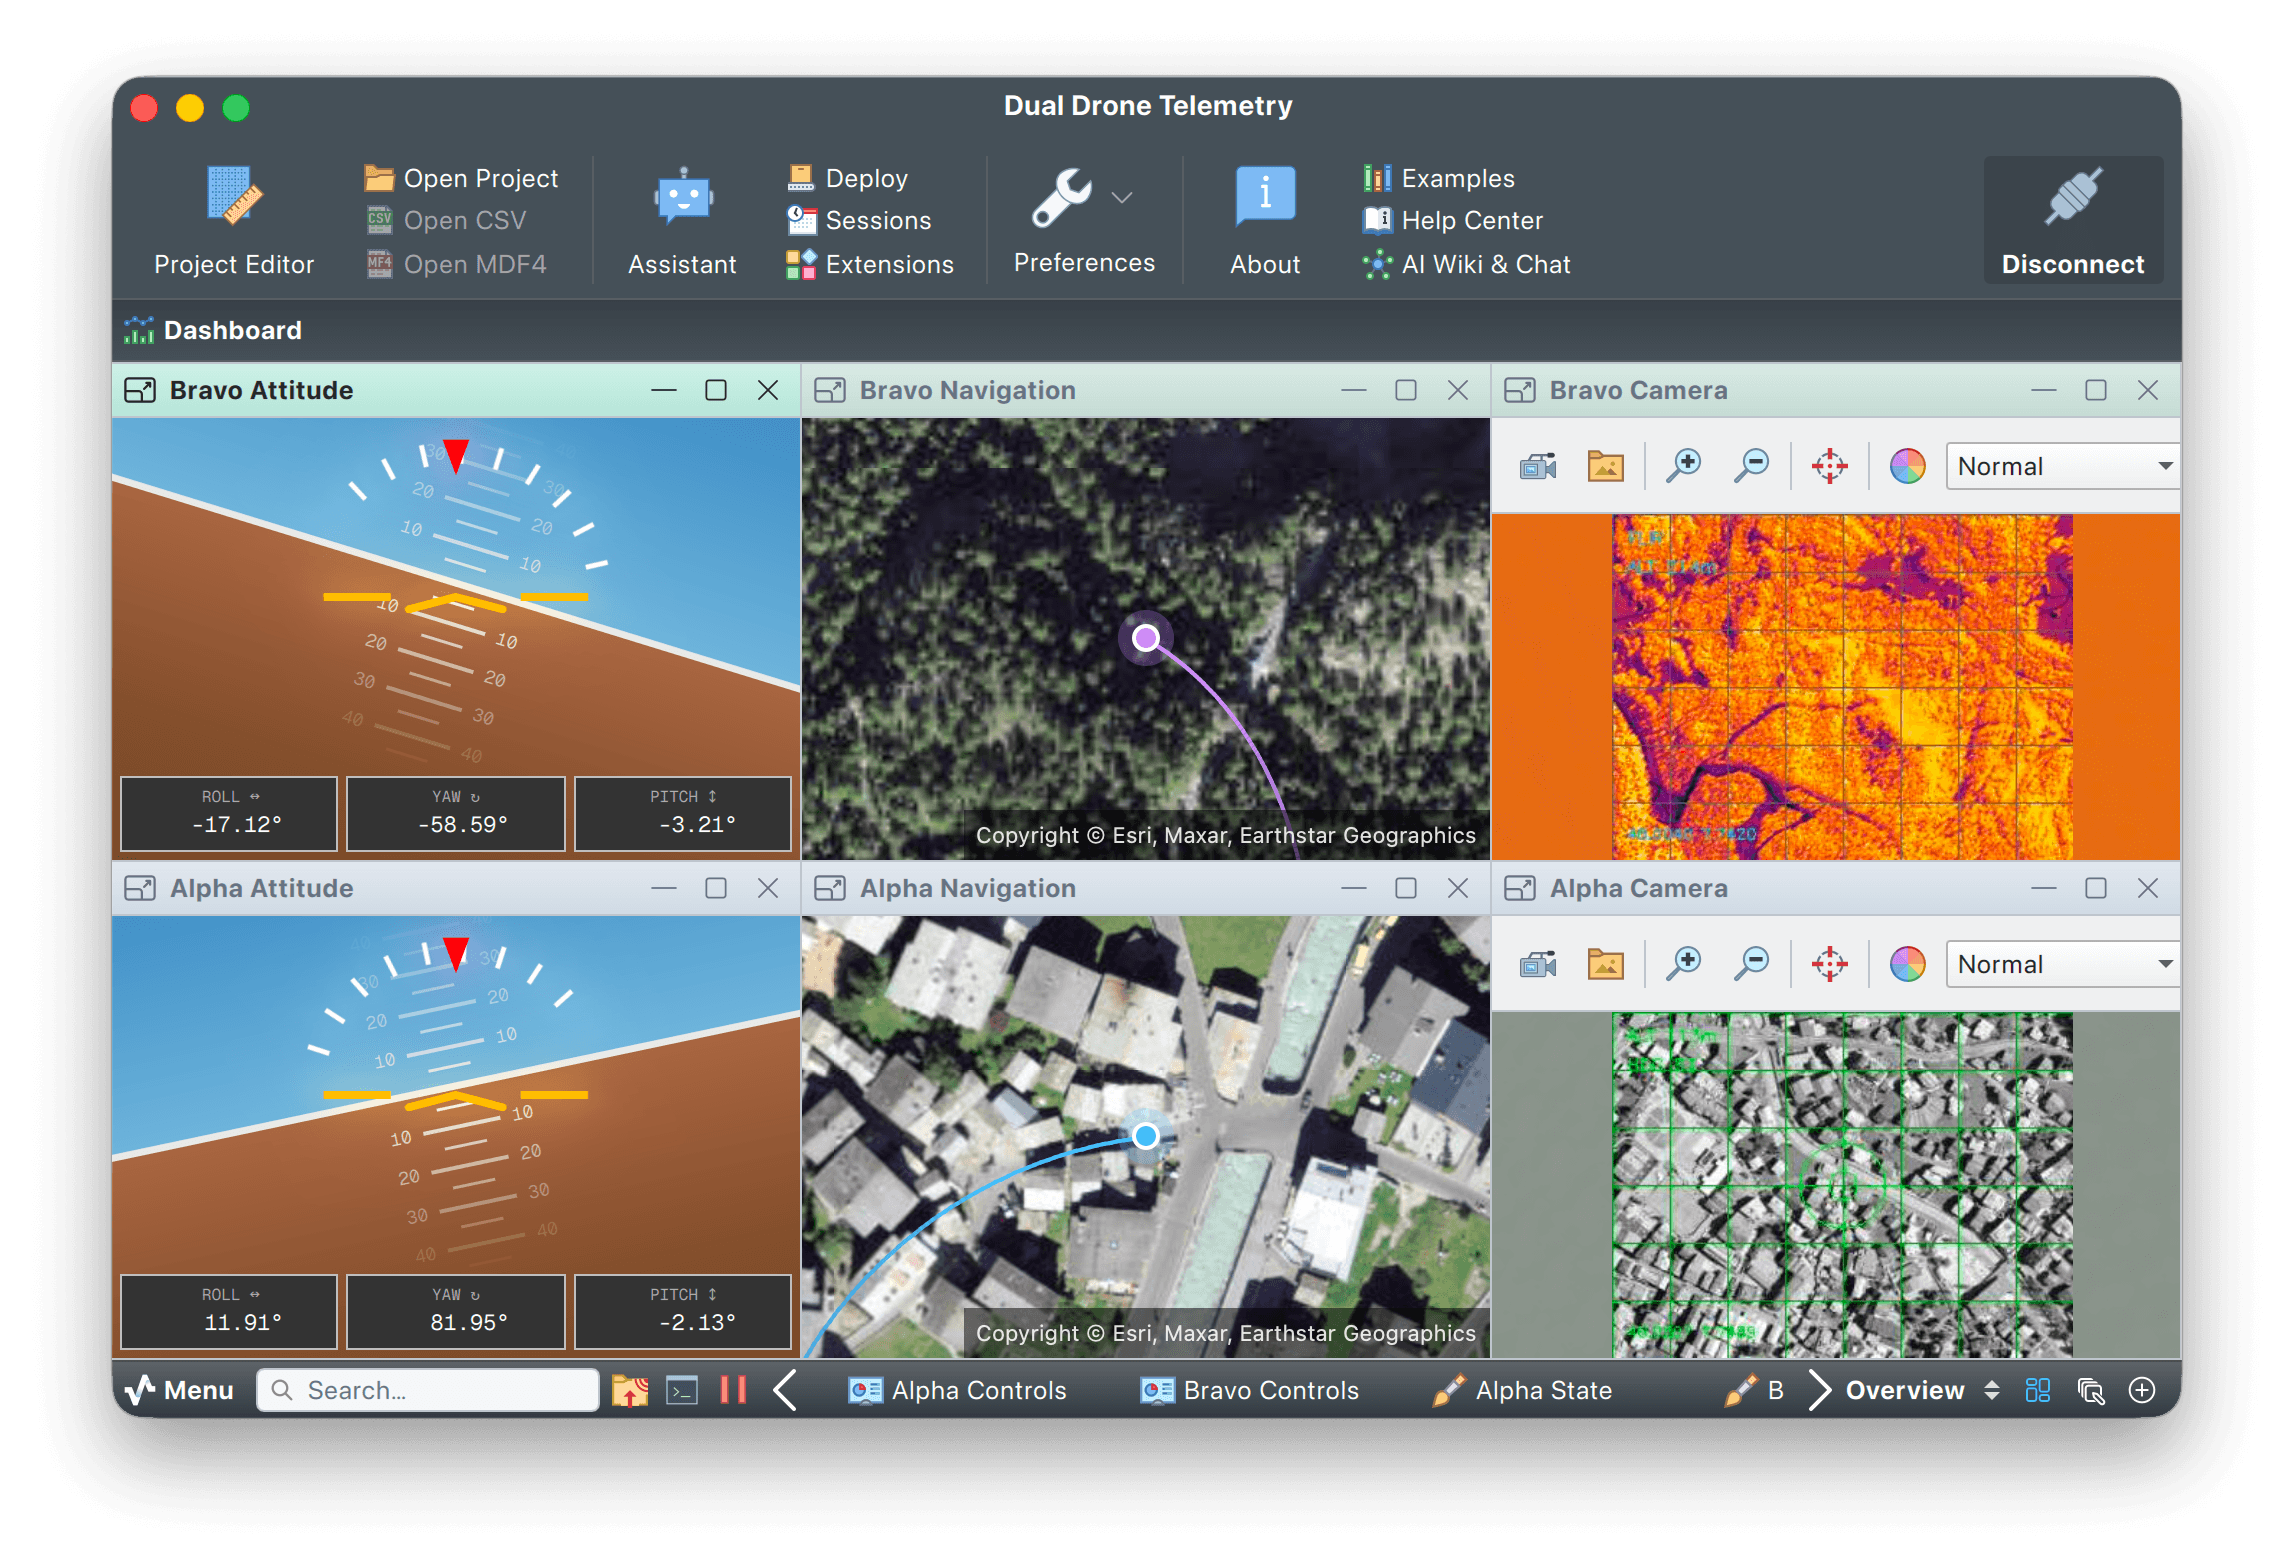
Stream joint angles, encoder counts, motor currents and IMU data in real time. Add plots, gauges and a 3D view, then record every run to CSV and replay it later. Multi-device projects can read a gamepad over HID and the robot over BLE in the same session.
- Multi-device projects
- HID gamepads & joysticks
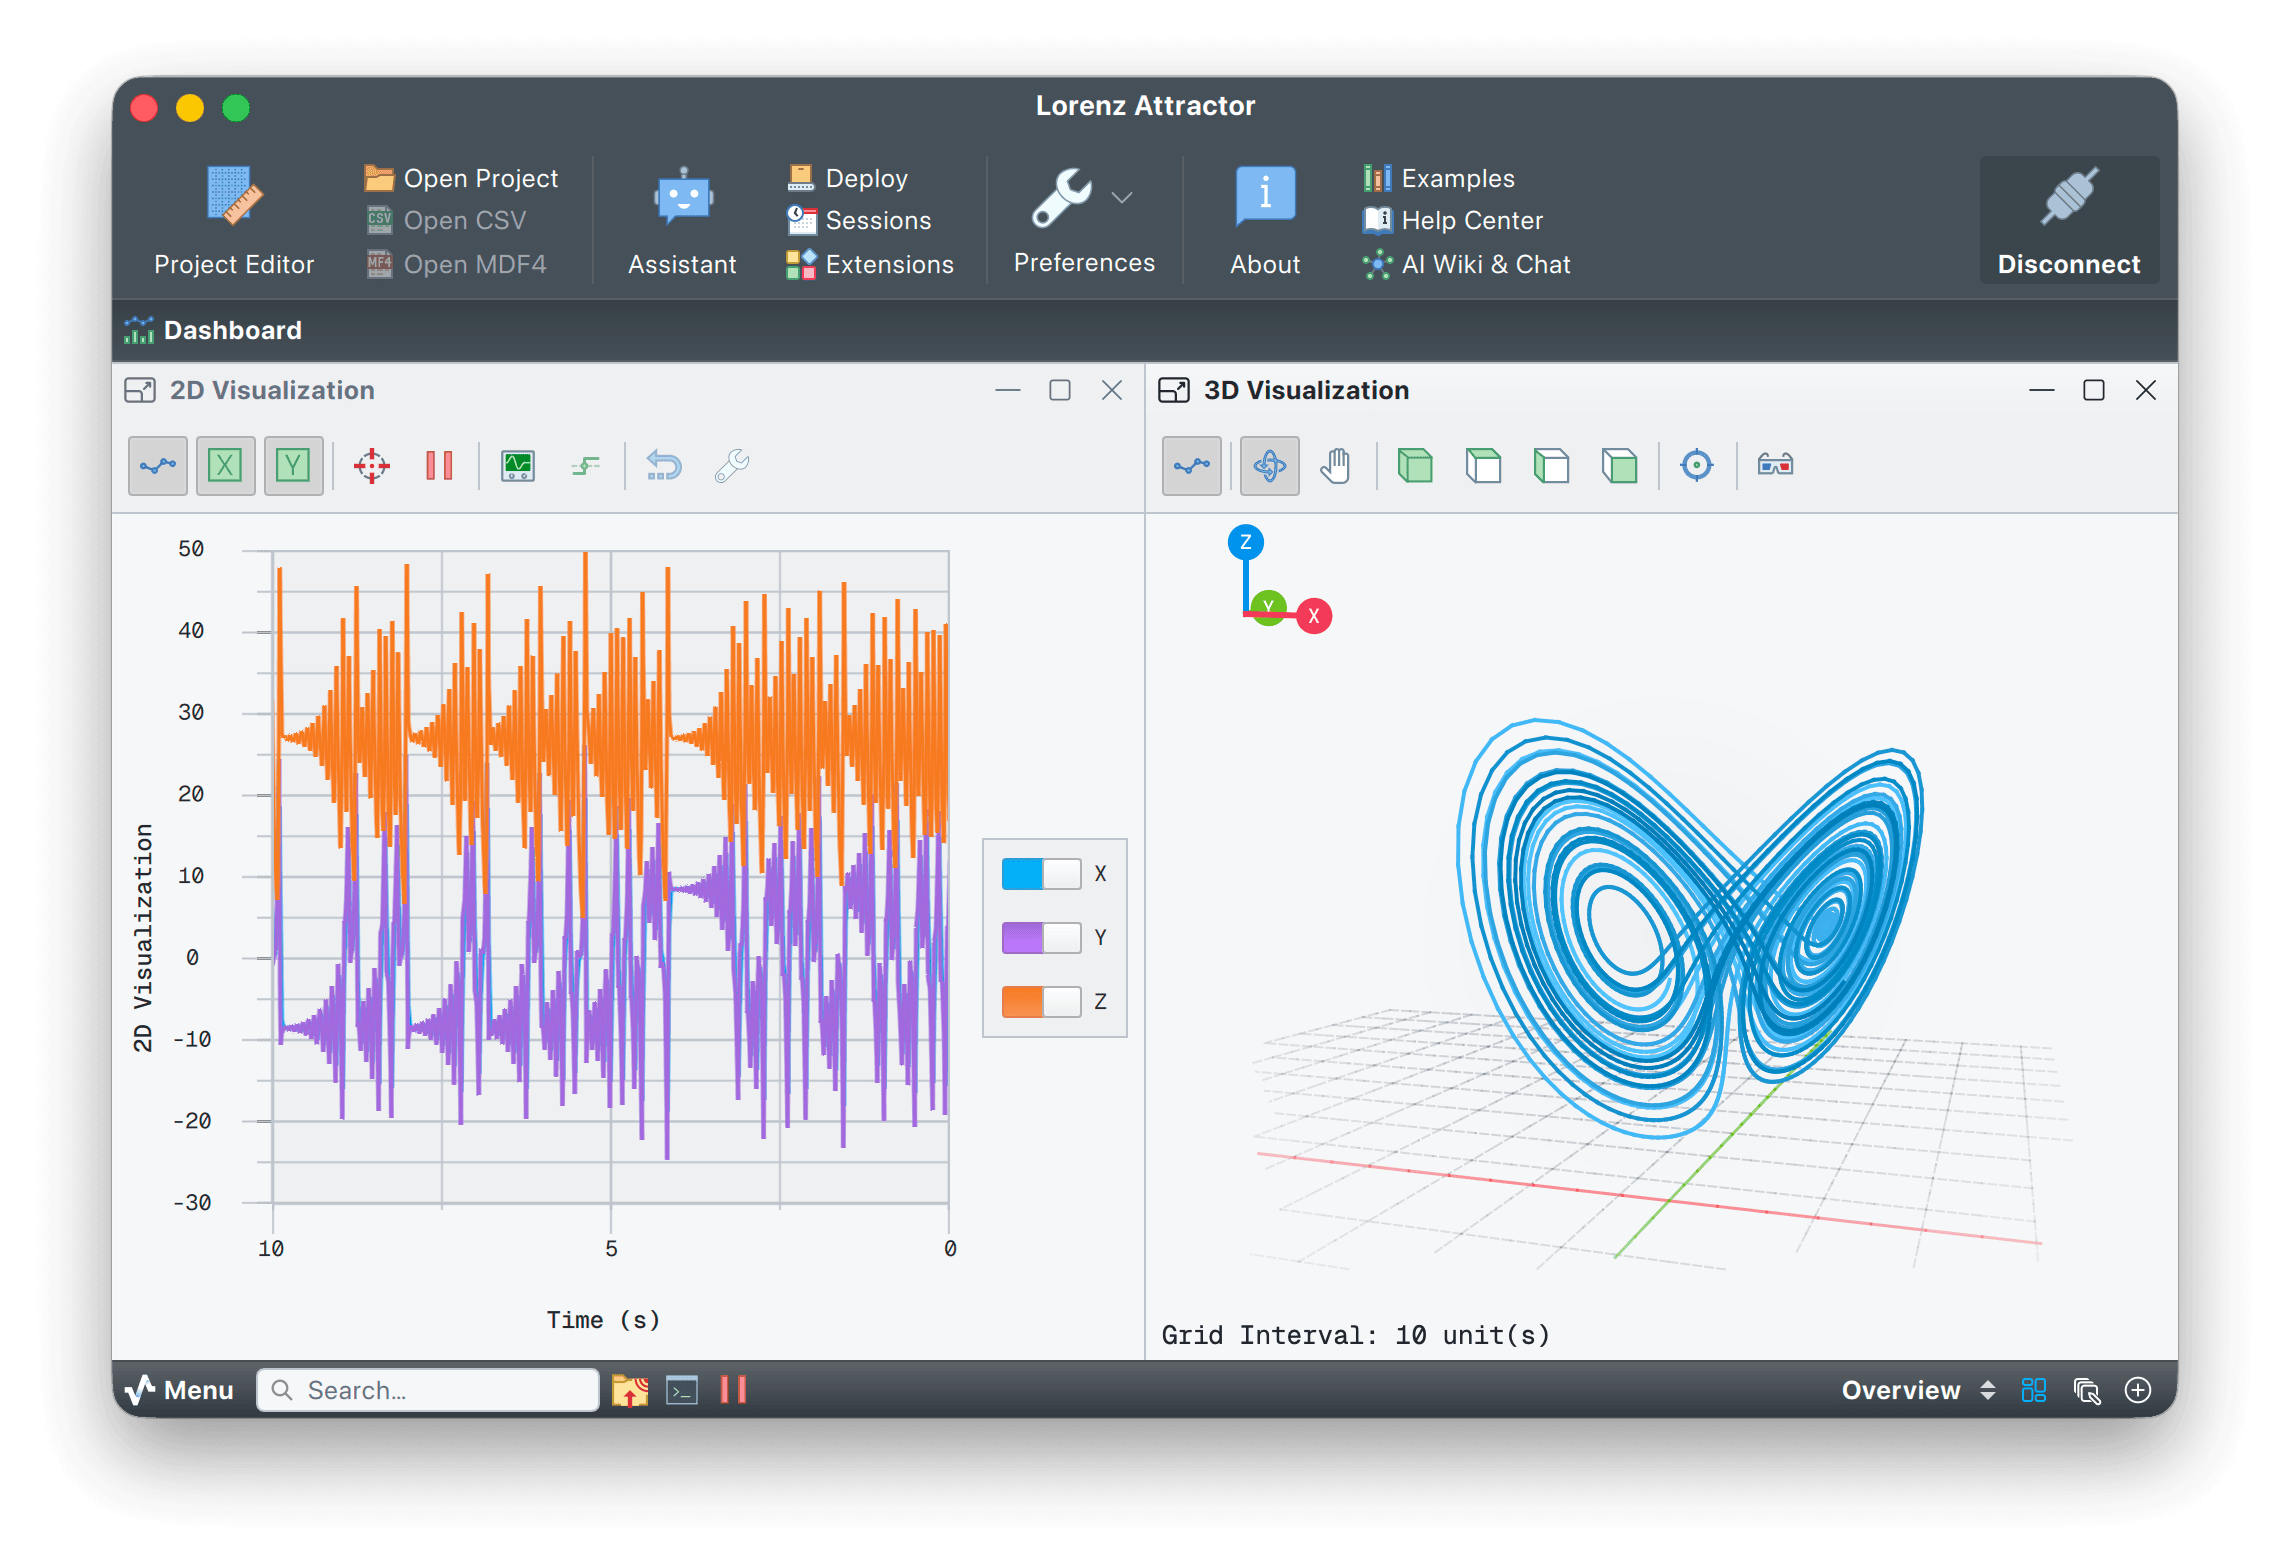
- 3D pose & trajectory view
- Output buttons & sliders
Decode CAN with DBC, log to MDF4
Import a vendor DBC and Serial Studio decodes the signals automatically. Watch ECU traffic live, log a race session to MDF4, then replay it in the same dashboard or open the file in CANalyzer, MATLAB or Python.
- DBC auto-decode
- SocketCAN & PCAN
- MDF4 read/write
- CANalyzer-compatible
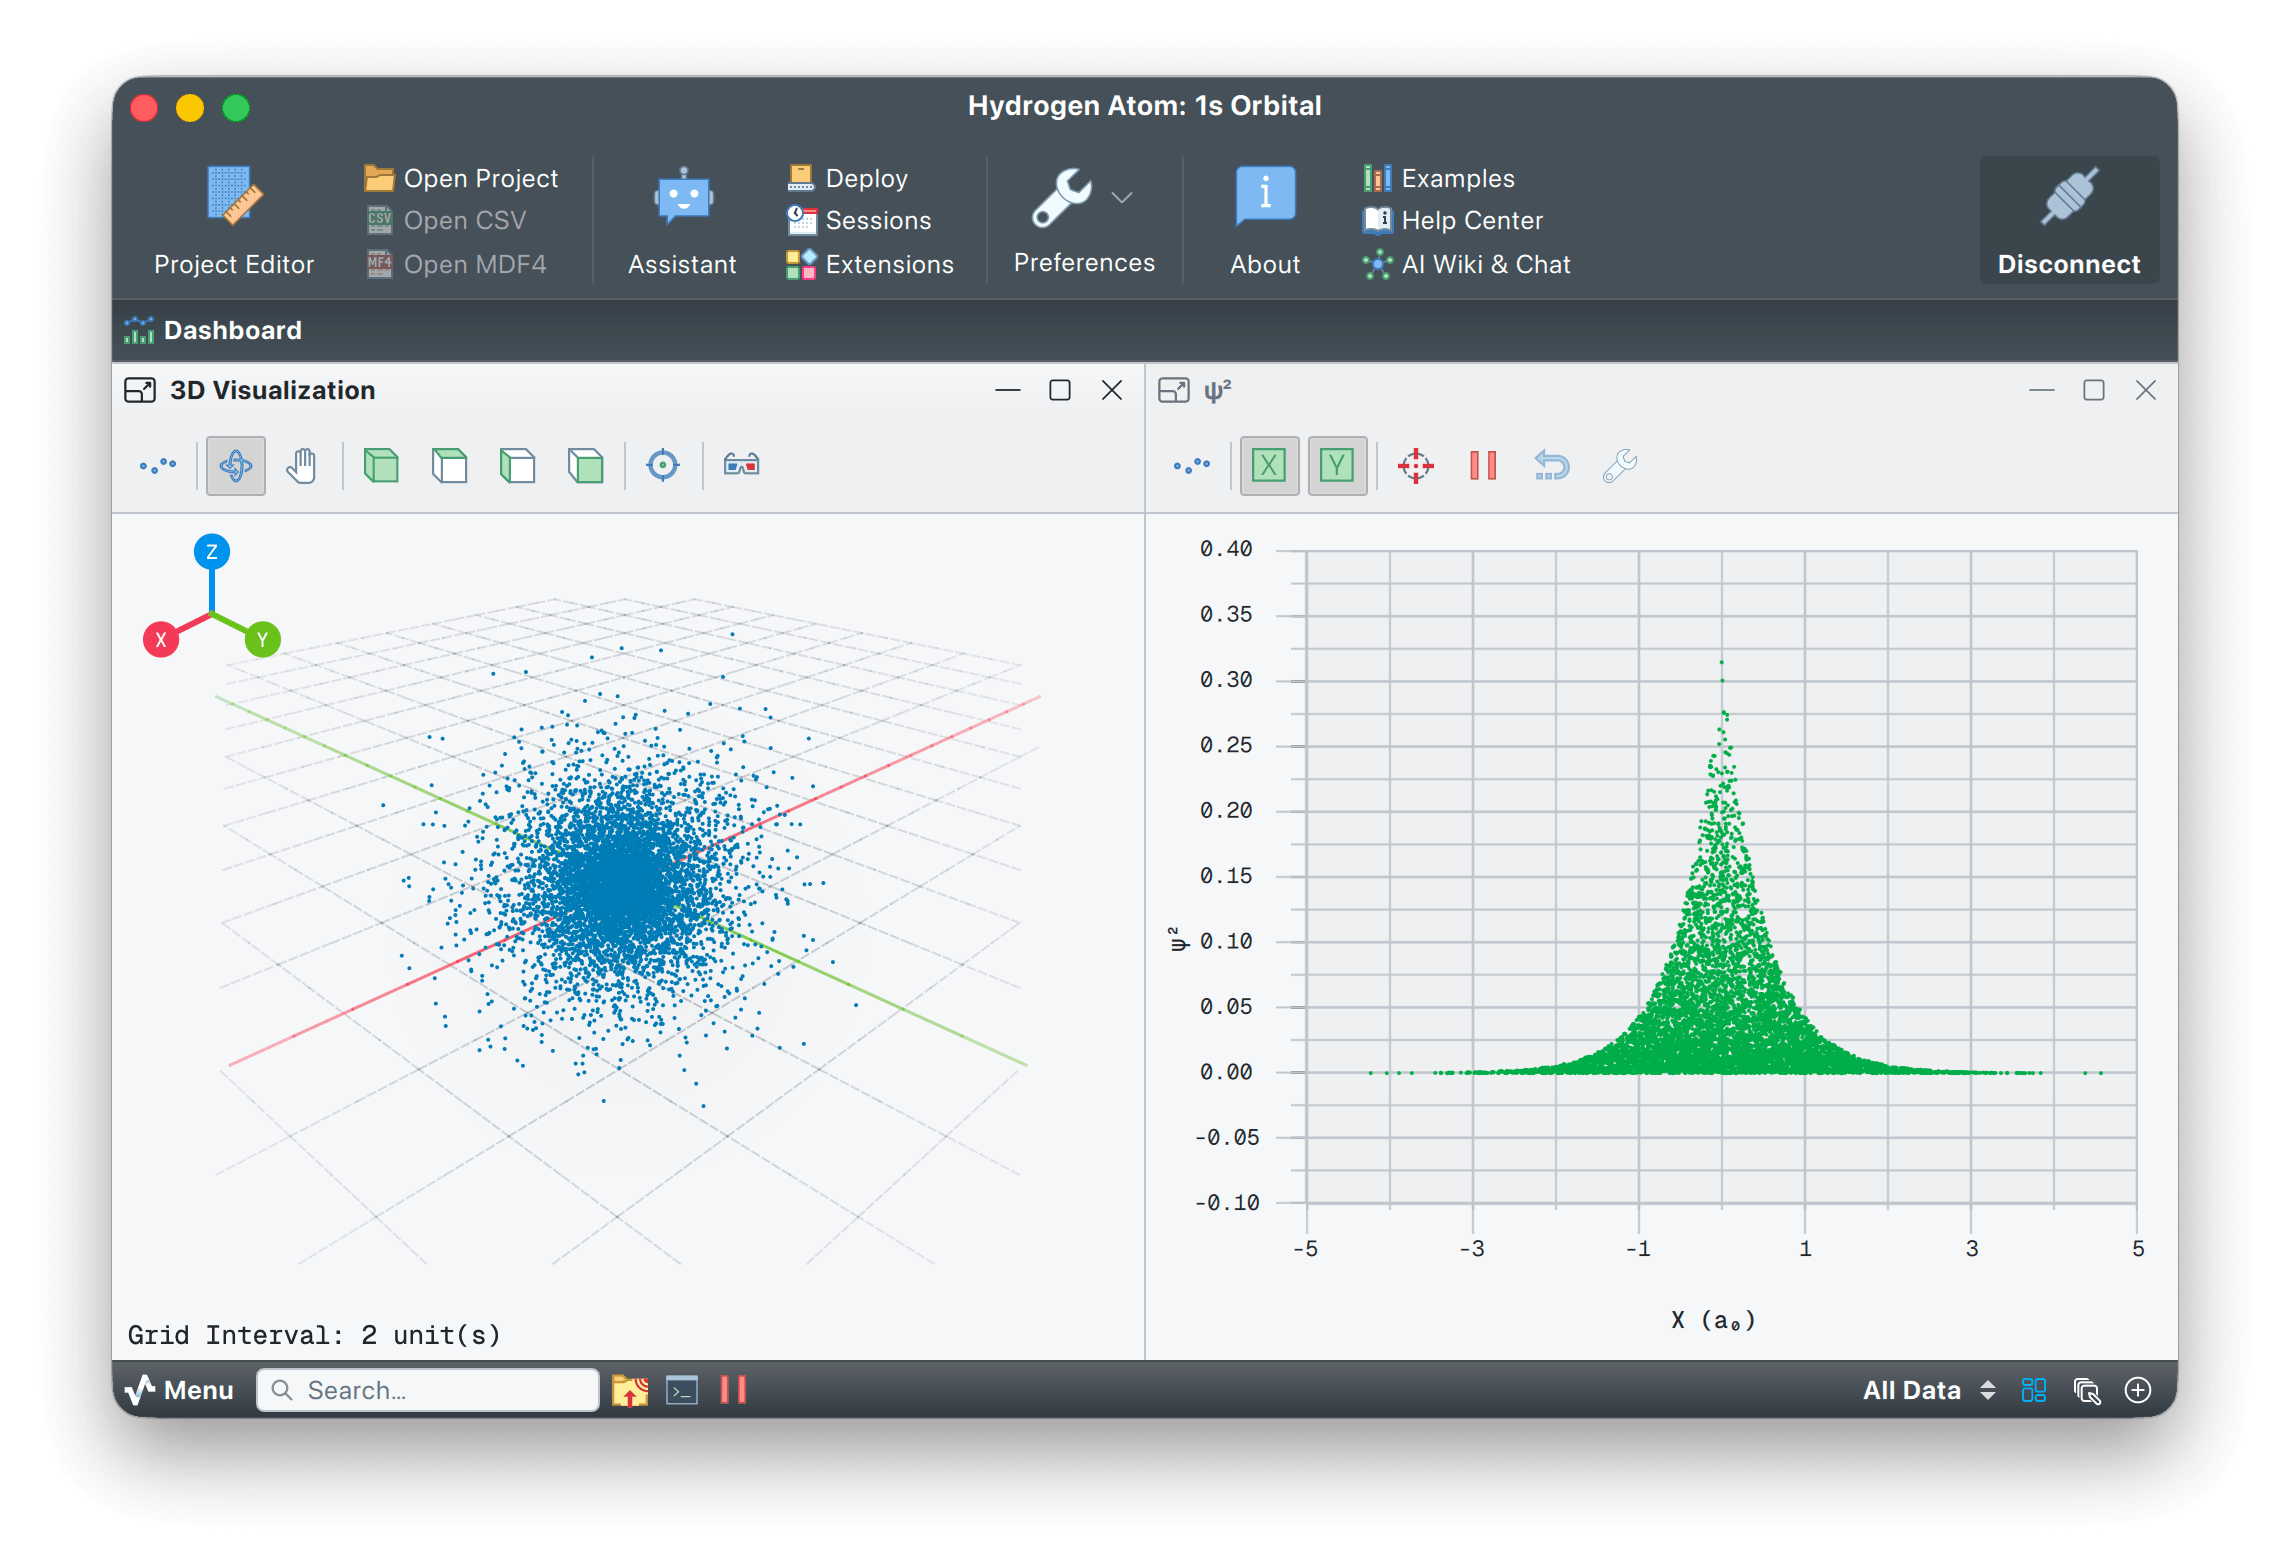
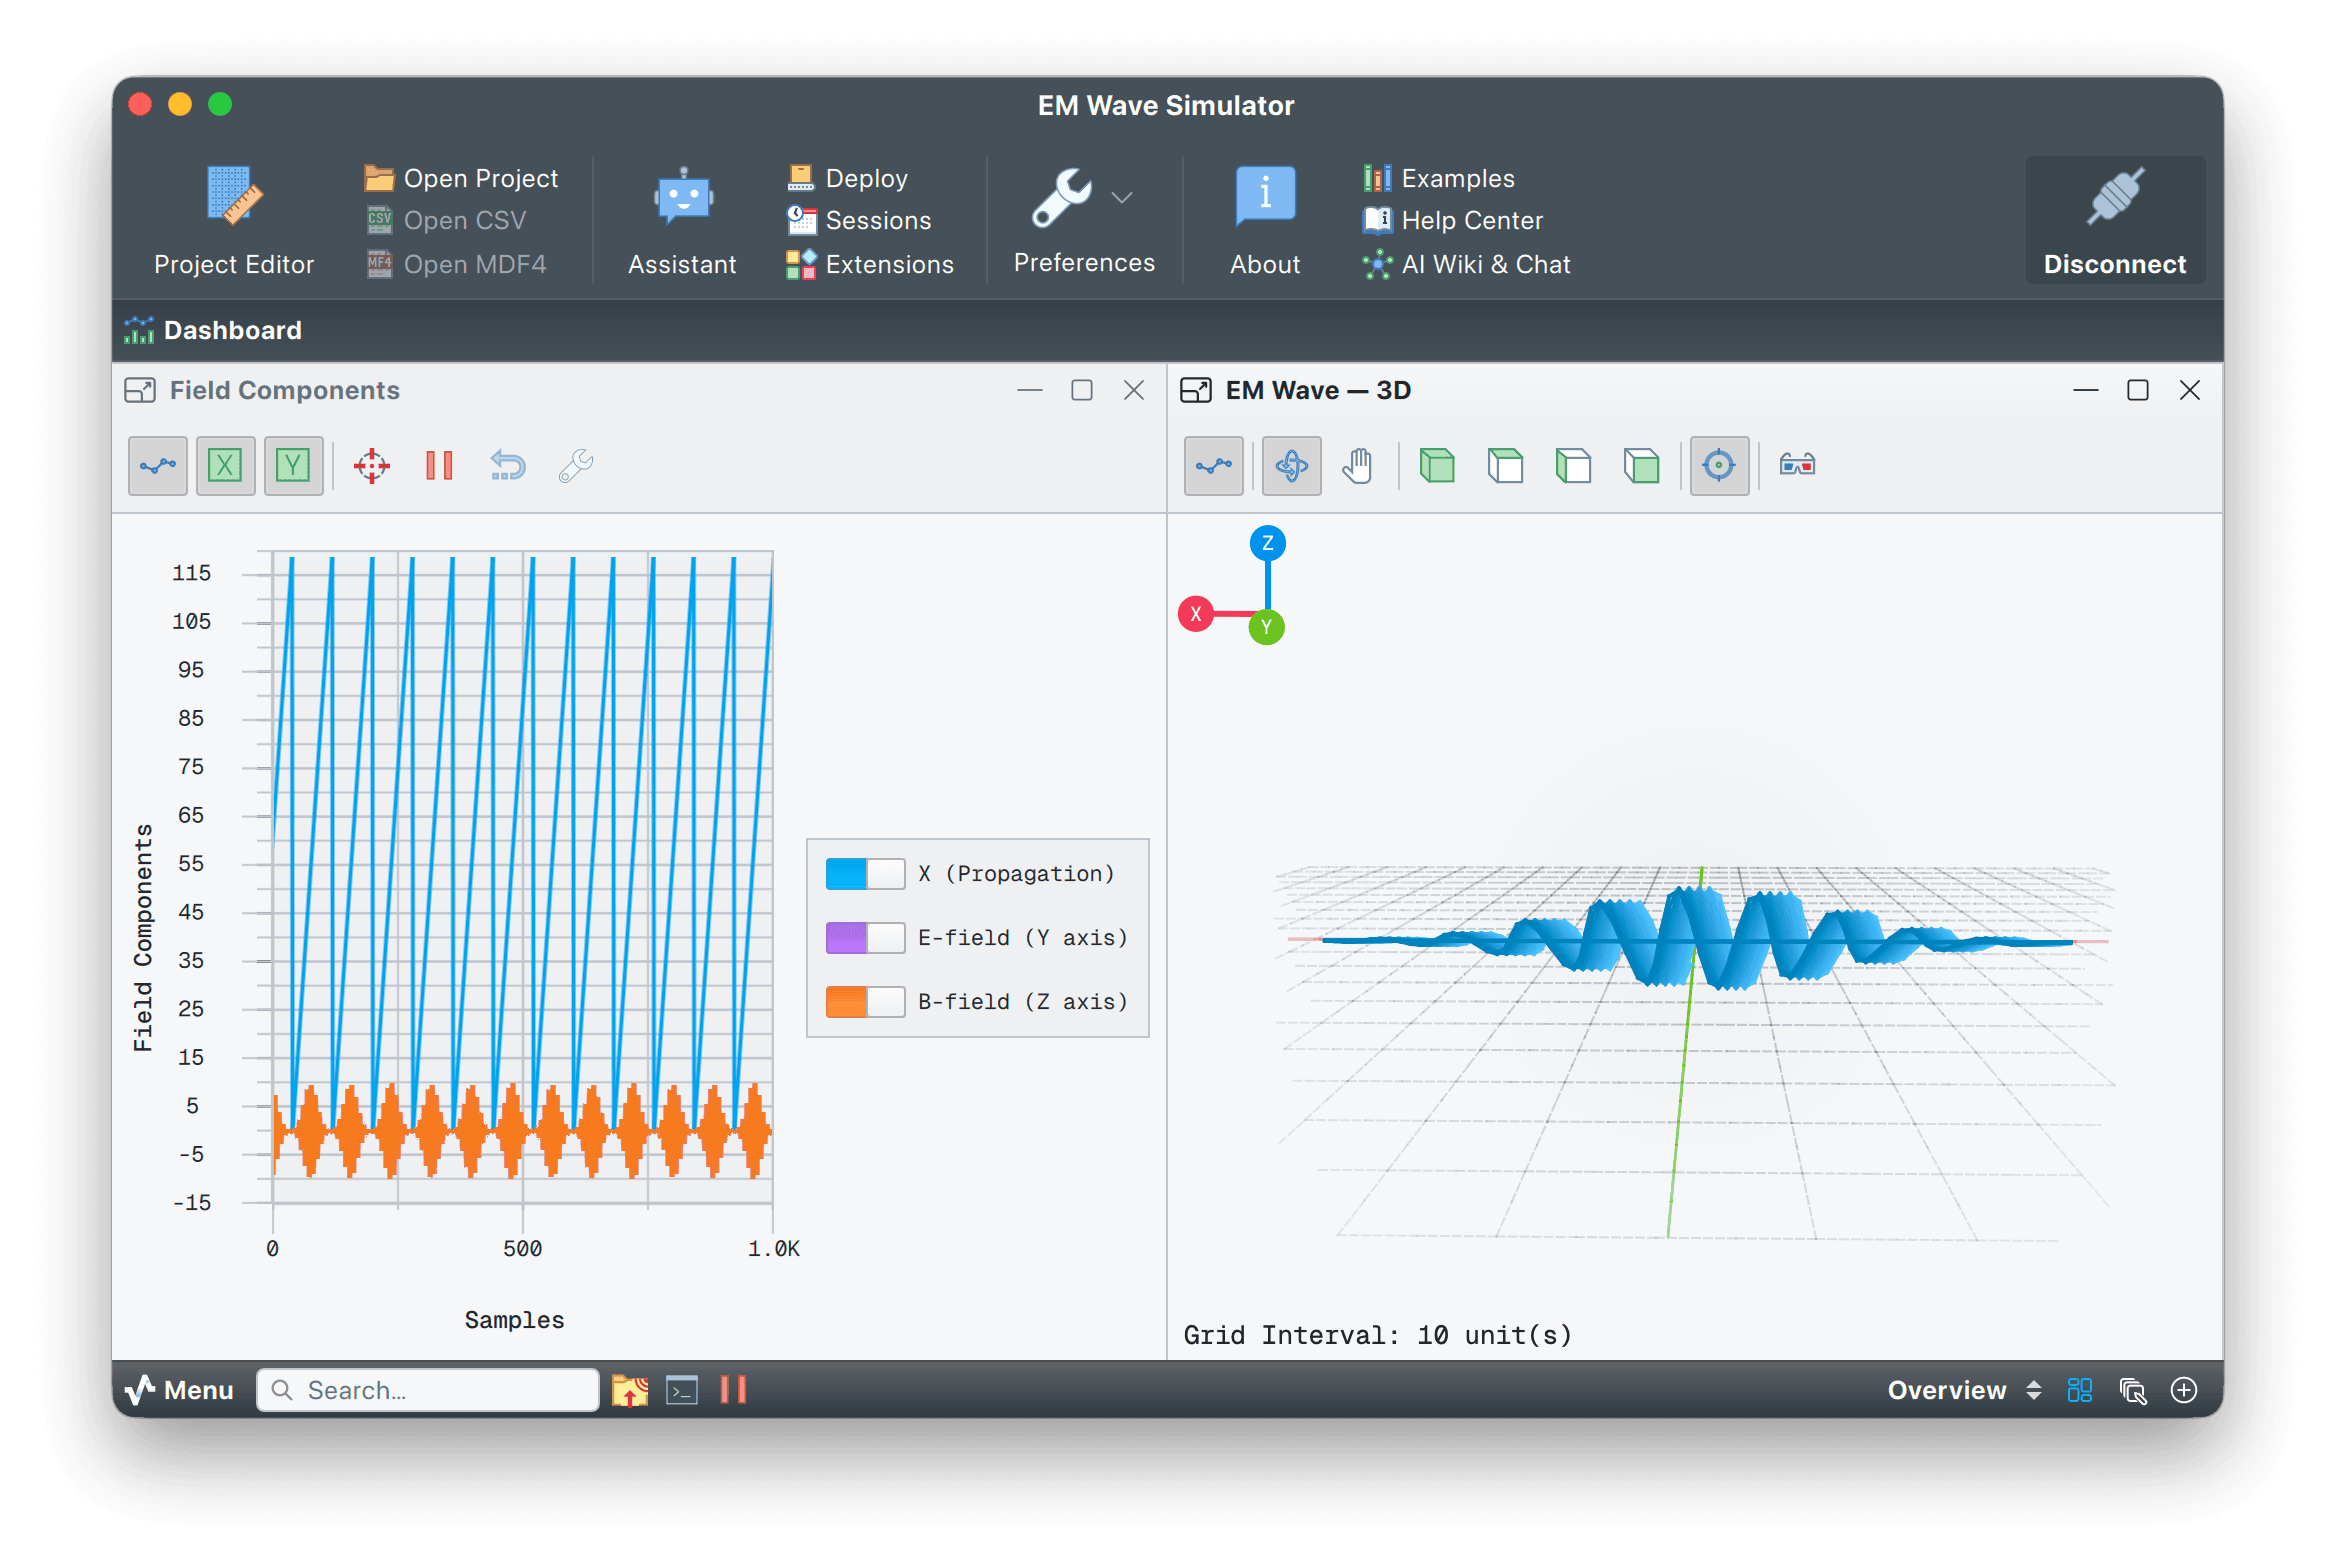
Telemetry, video and flight test on one screen
Decode MAVLink, NMEA or a custom packet format with a JavaScript or Lua parser. Pin a camera feed next to attitude, altitude and GPS plots in the ImageView widget. Common on CanSat, CubeSat and model-rocket teams, where the same dashboard records the flight and exports a PDF for the debrief.
- MAVLink & NMEA
- GPS map widget
- Live camera feed
- CanSat / CubeSat ready
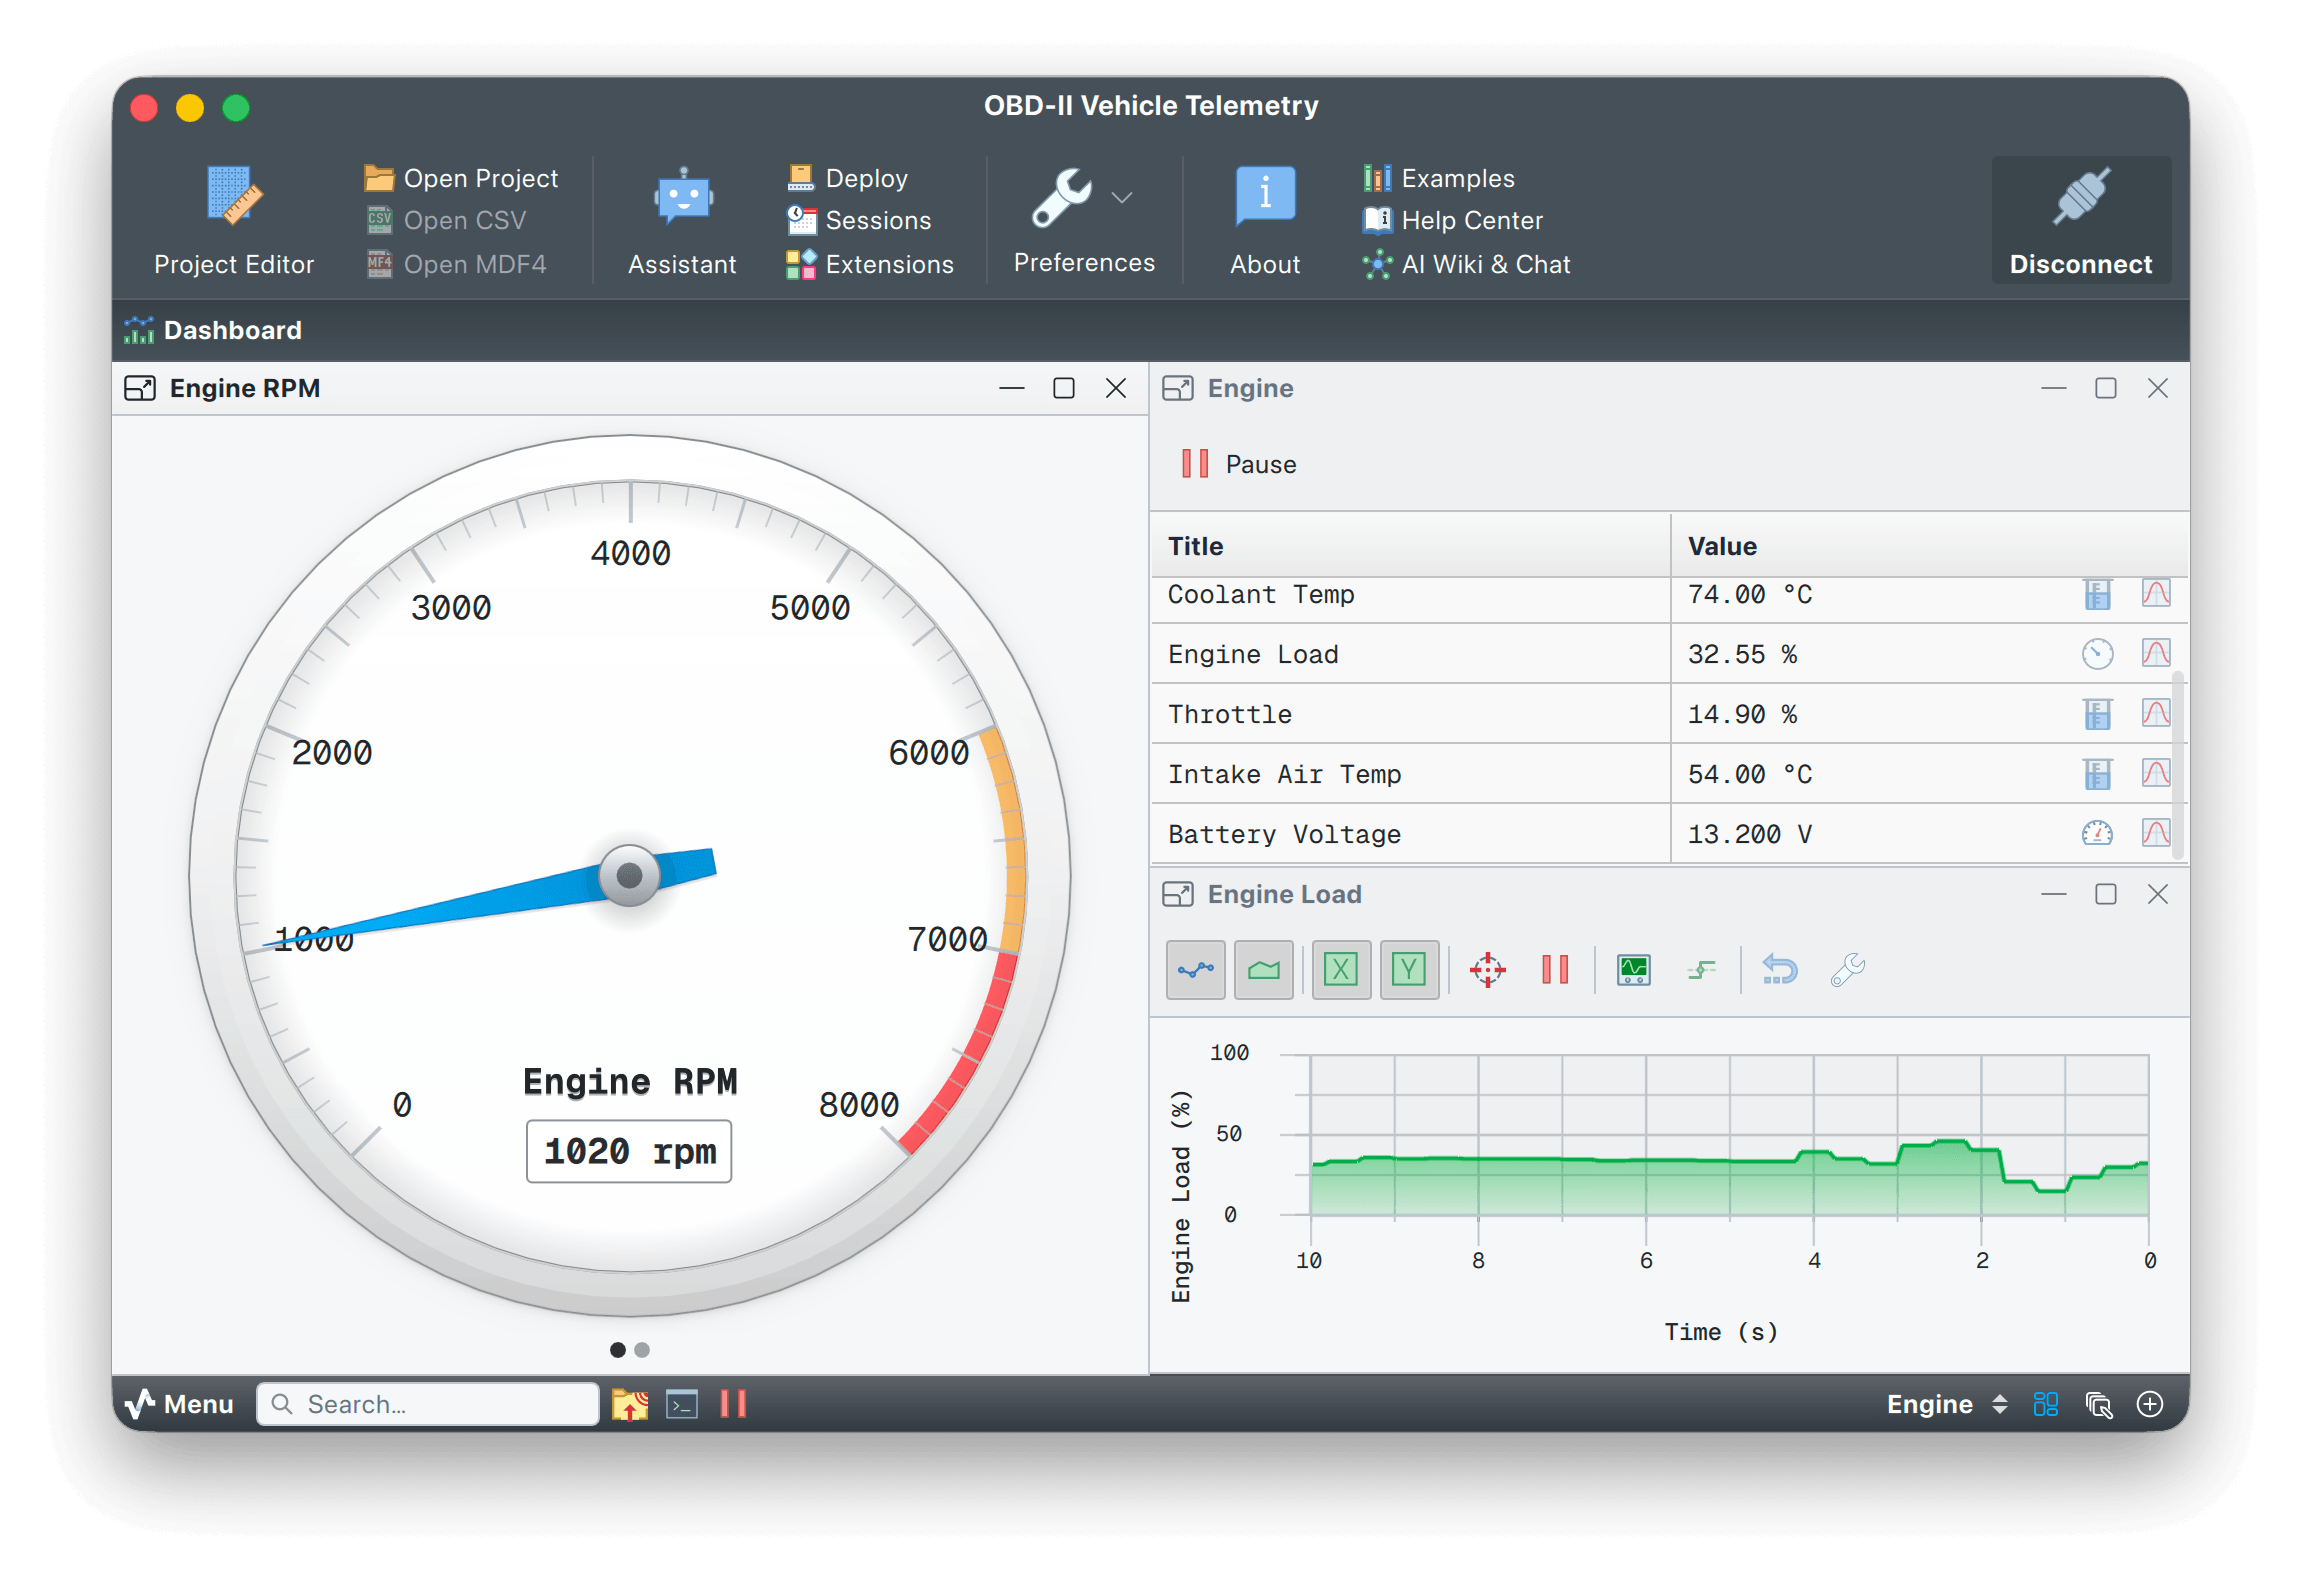
From bench measurements to a publishable dataset
Connect a microcontroller, sensor or instrument and print CSV. Quick Plot draws it without a project file. With Pro, the audio driver turns a USB sound card into a multichannel oscilloscope, dataset transforms apply calibration coefficients per frame, and the session database tags and replays each run from SQLite. Export a PDF session report when the experiment is ready for a paper.
- Quick Plot (no project)
- Audio driver as scope
- SQLite session DB
- Calibration transforms
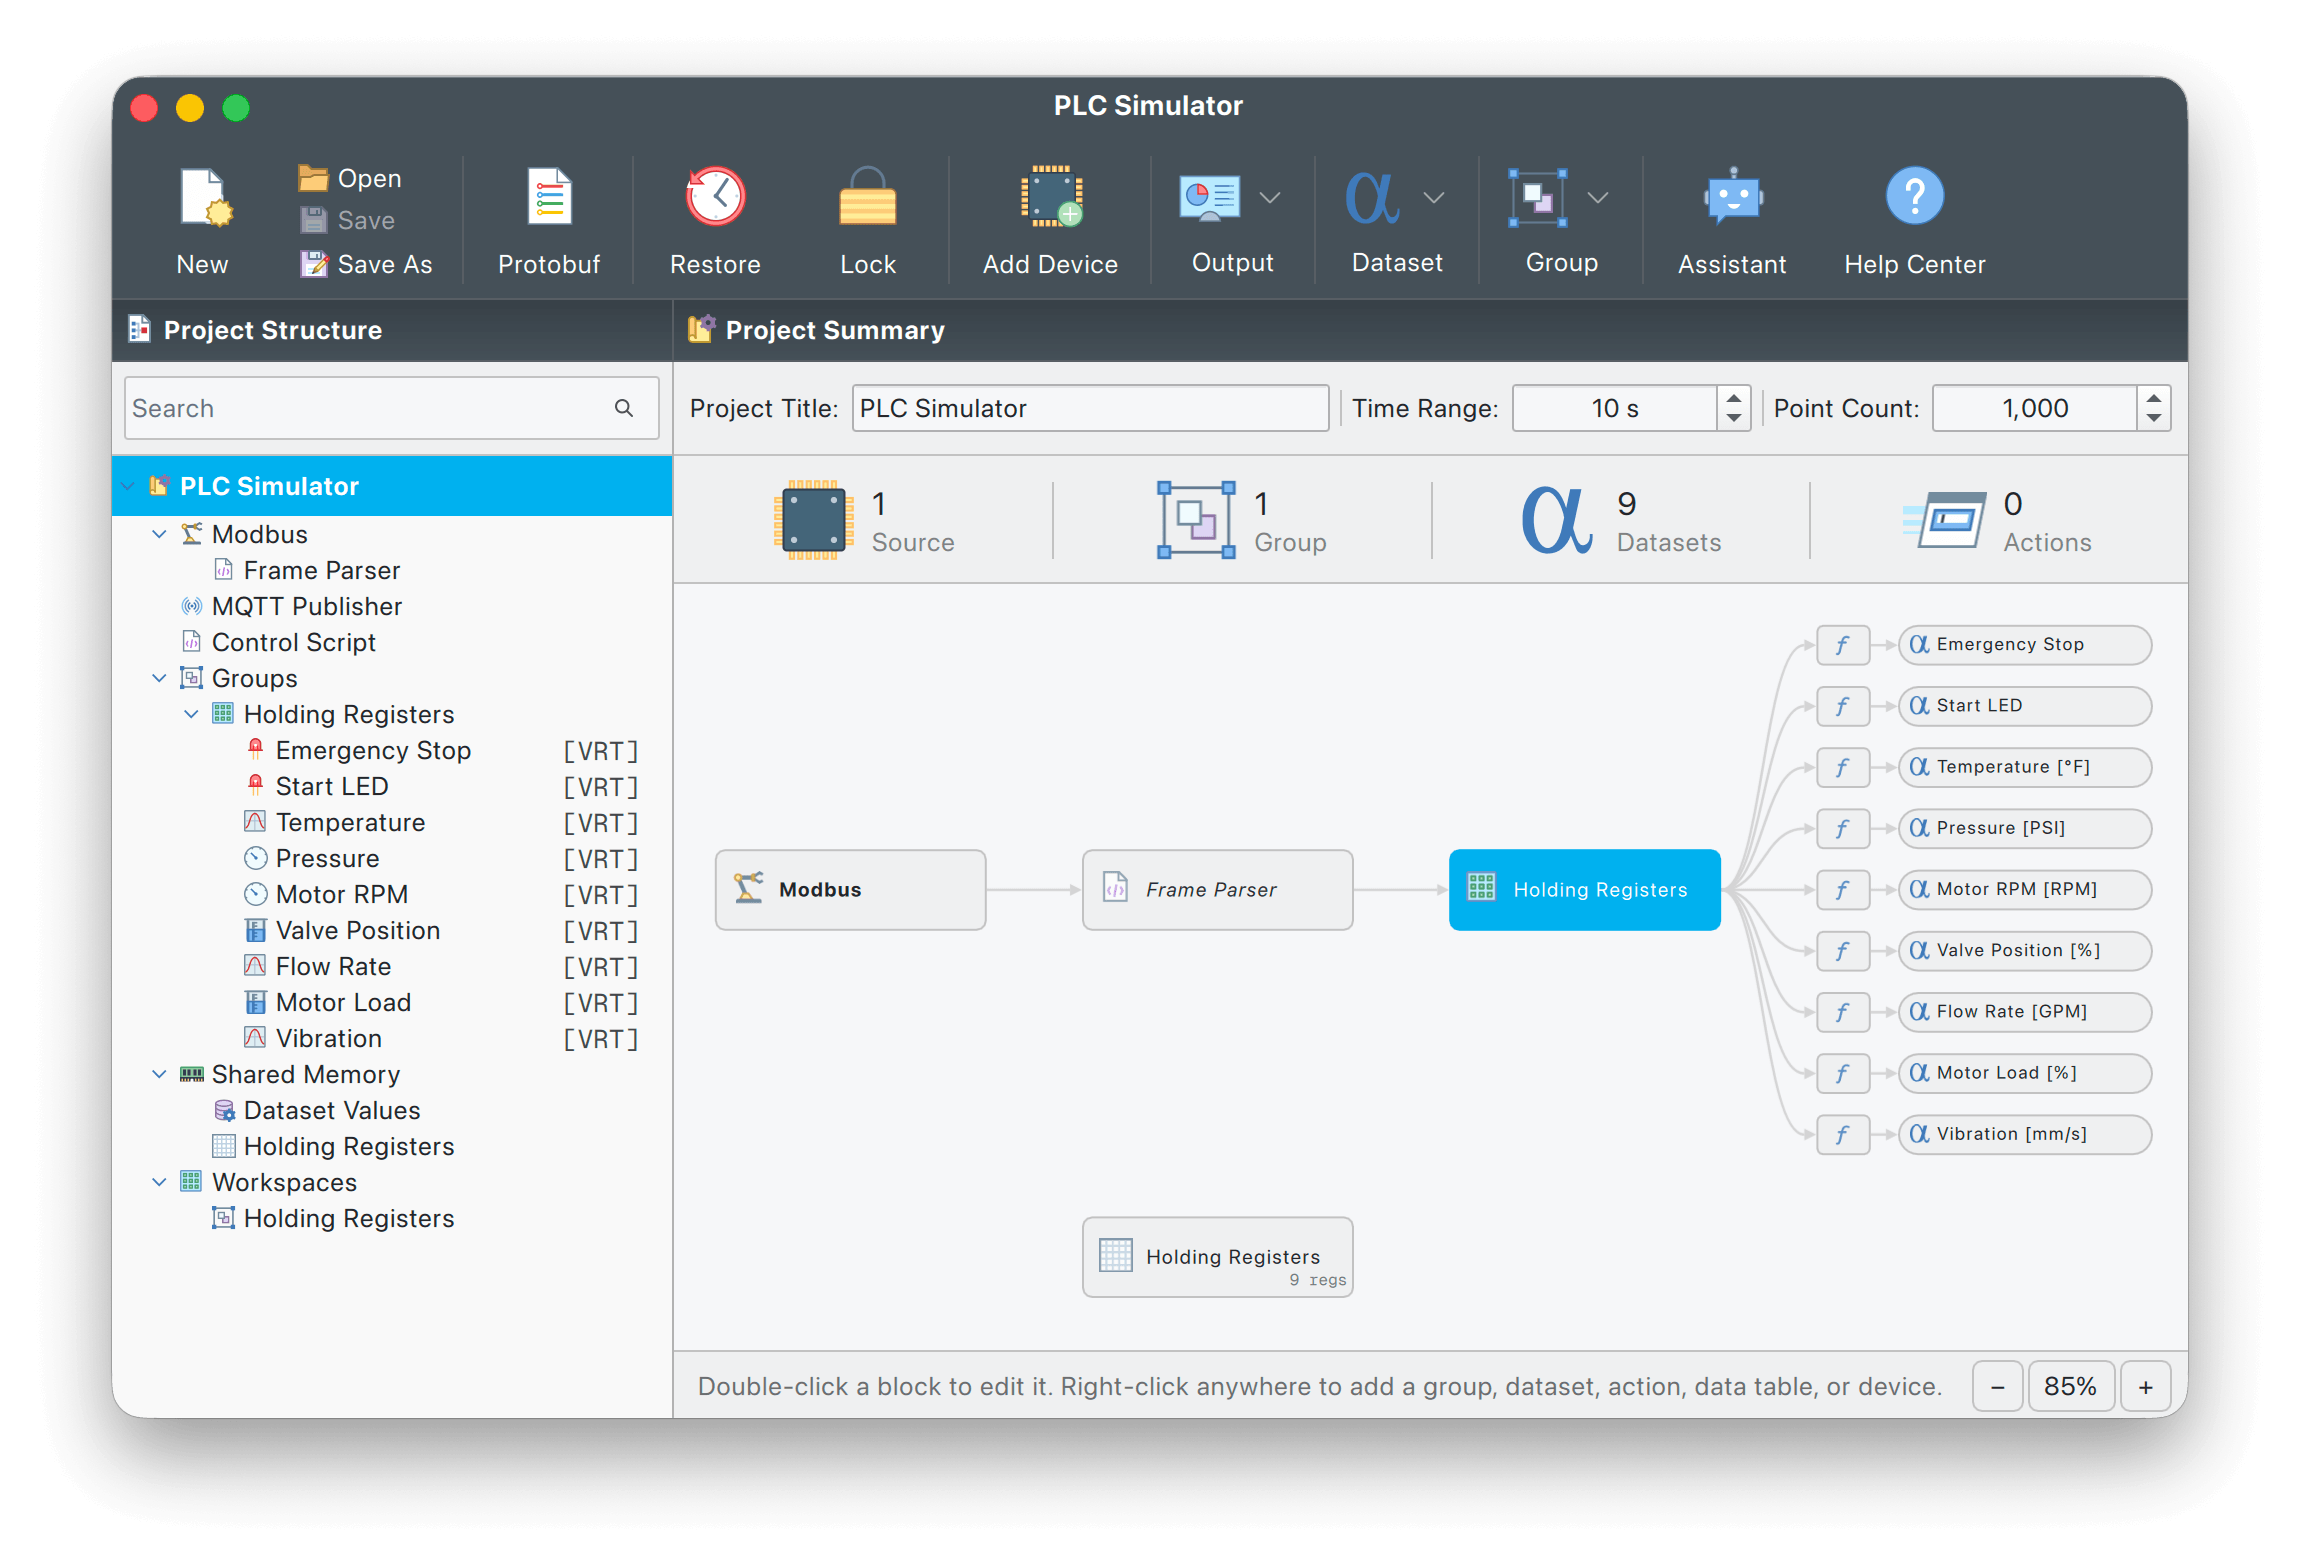
Traceable acquisition for the production line
Poll Modbus RTU or TCP registers, bridge them to an MQTT broker, and store every reading in a session database. Data Tables hold calibration constants and computed registers. Dataset transforms apply the math per frame, and every session keeps both the raw and the computed values. Reopen the project months later and the readings still match. Lock the project for the floor, and operators see a read-only dashboard.
- Modbus → MQTT bridge
- Register-map importer
- Project Lock (operator)
- Raw + computed audit
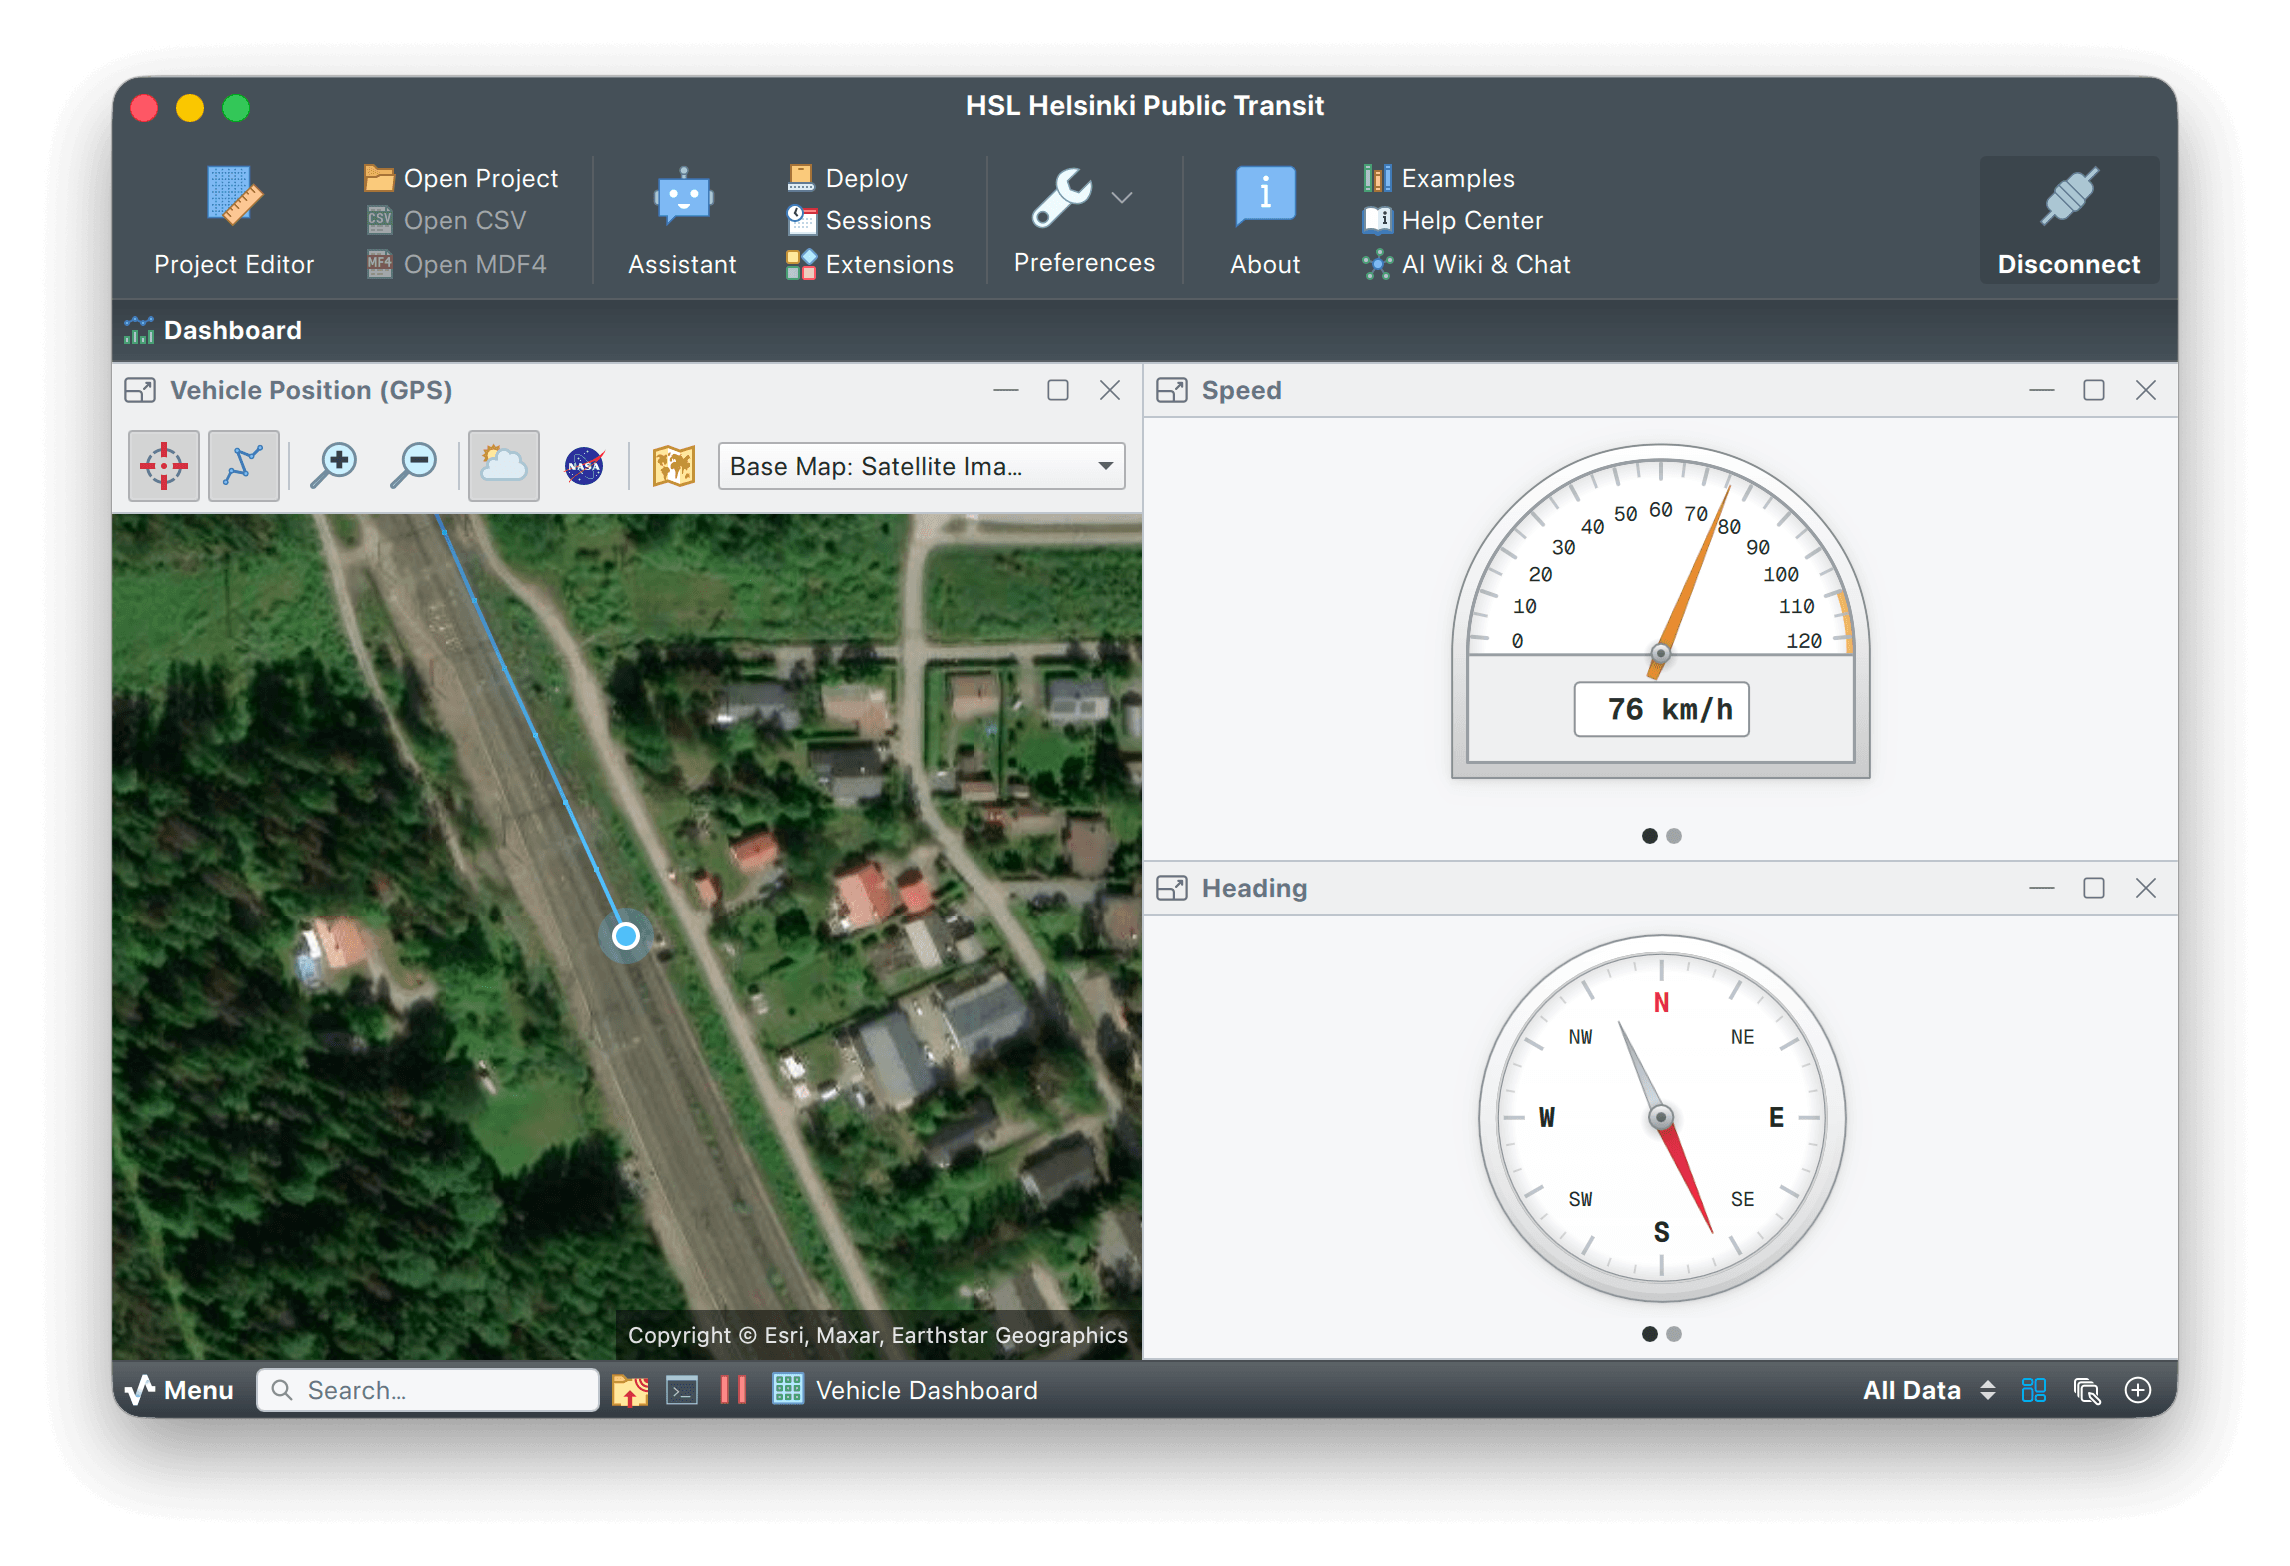
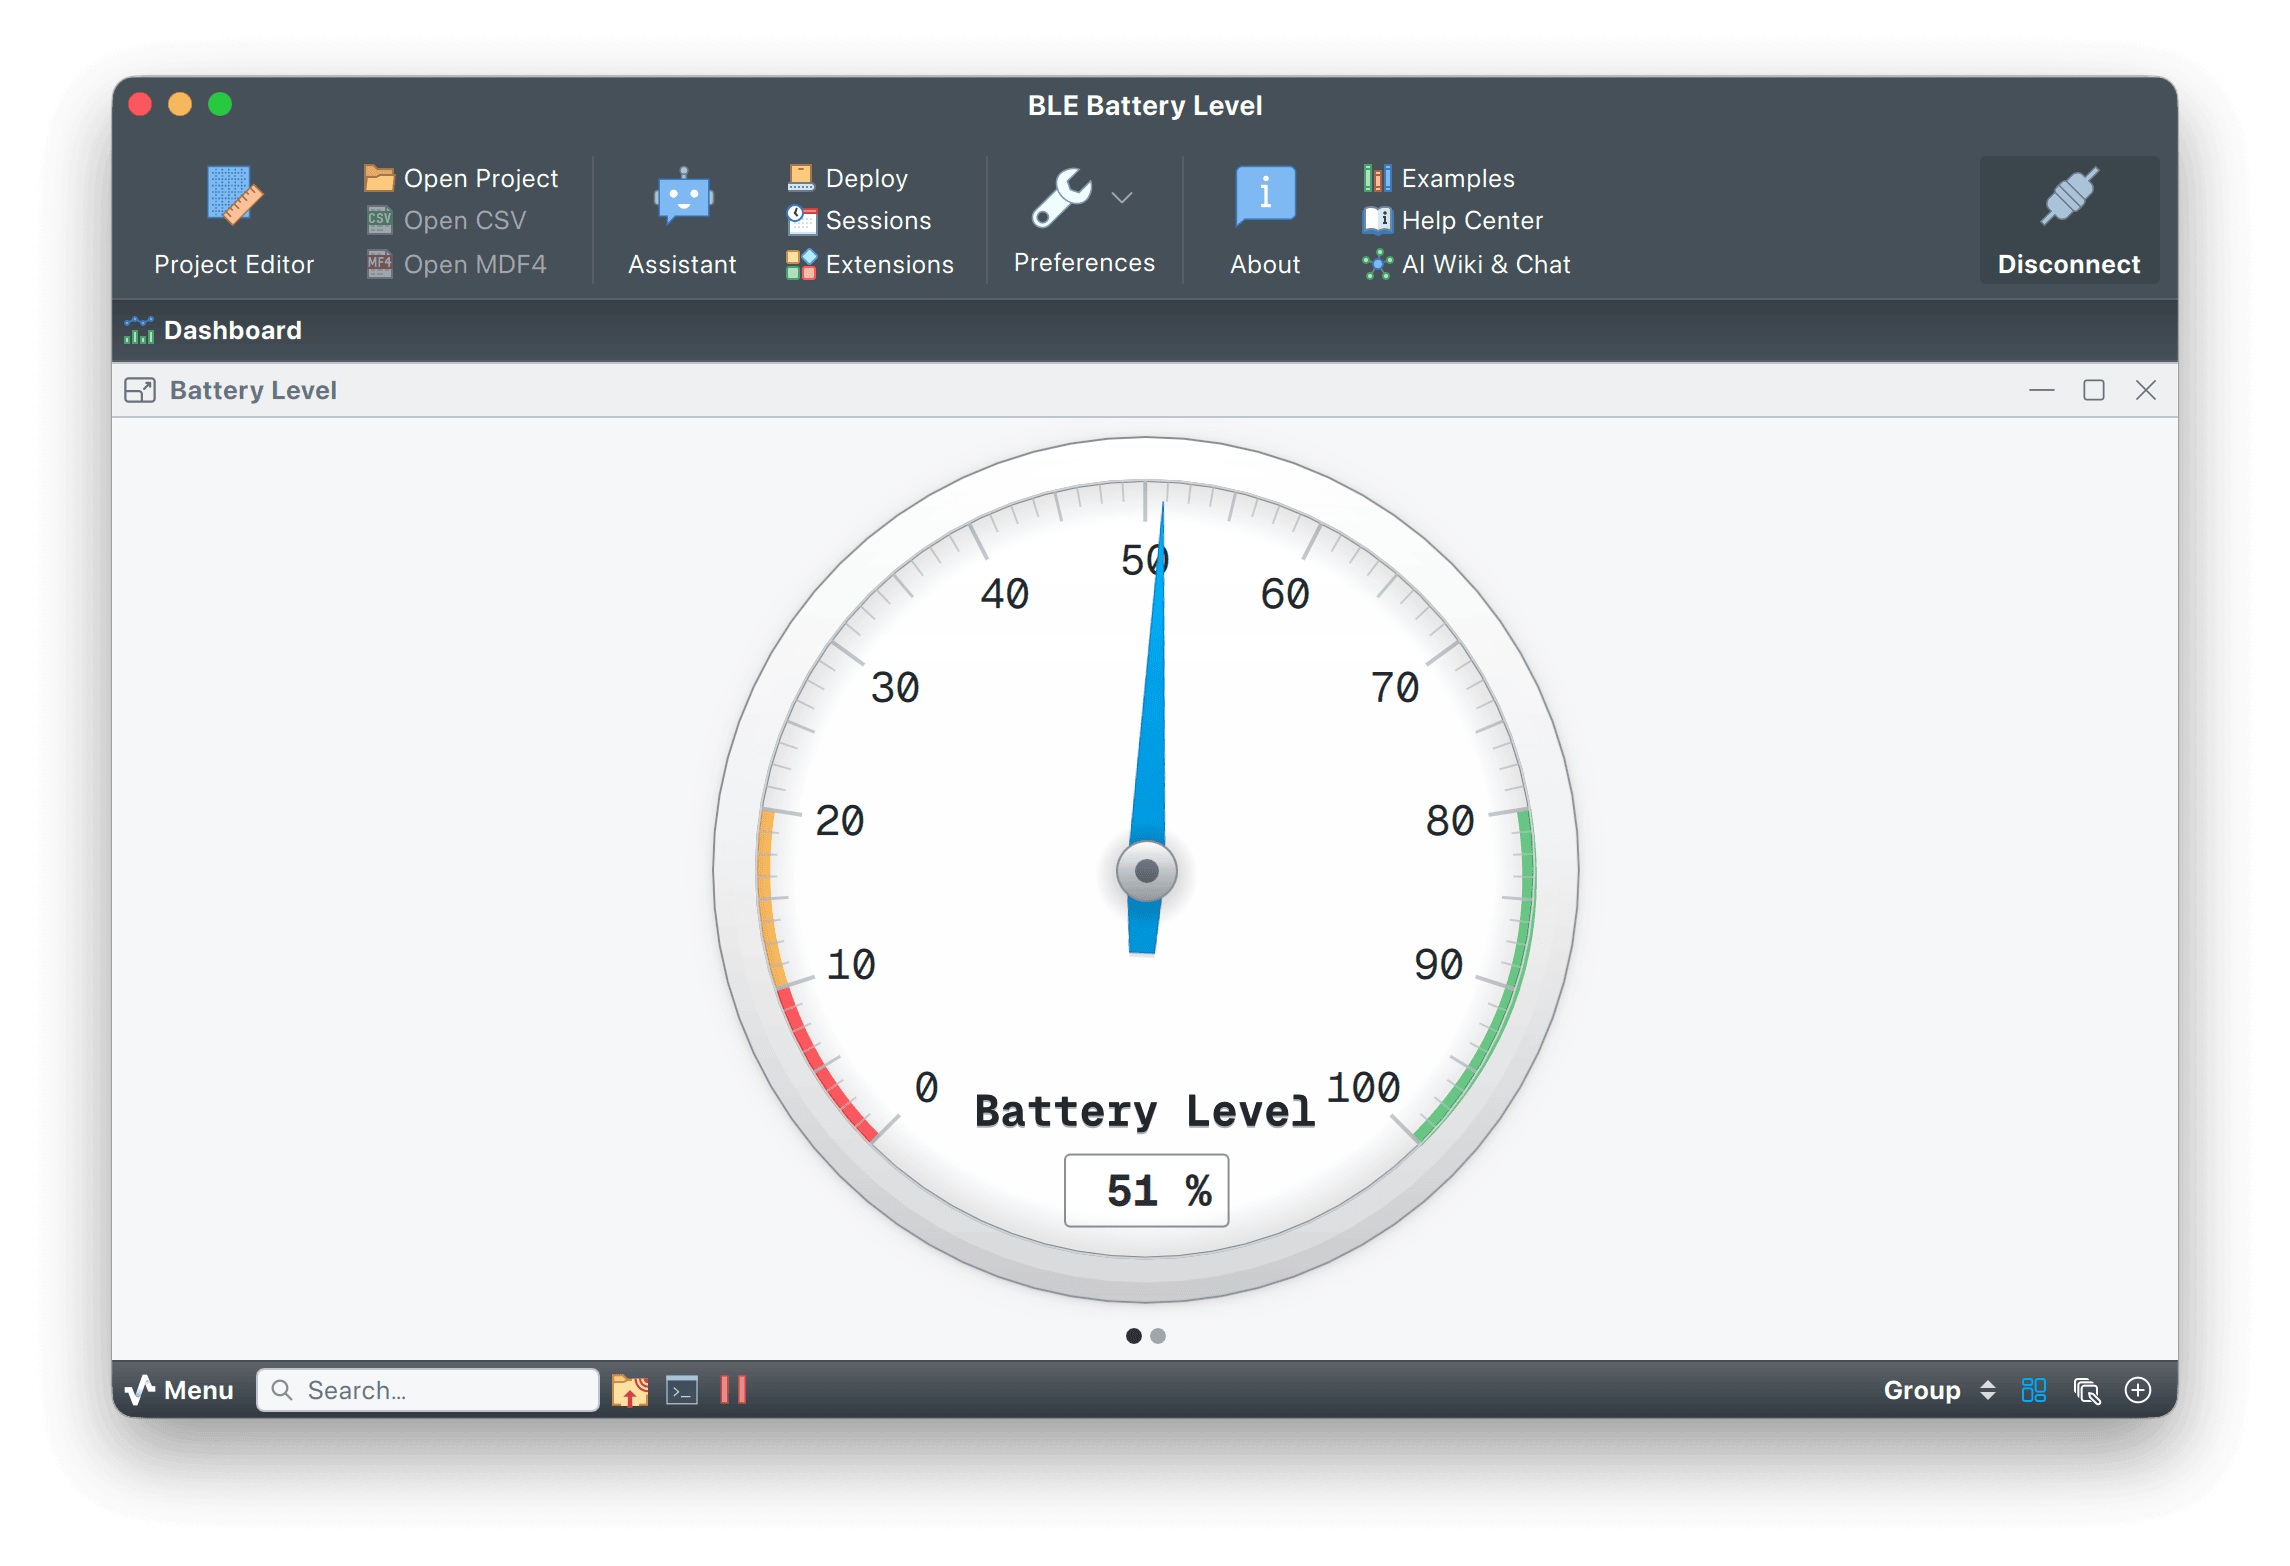
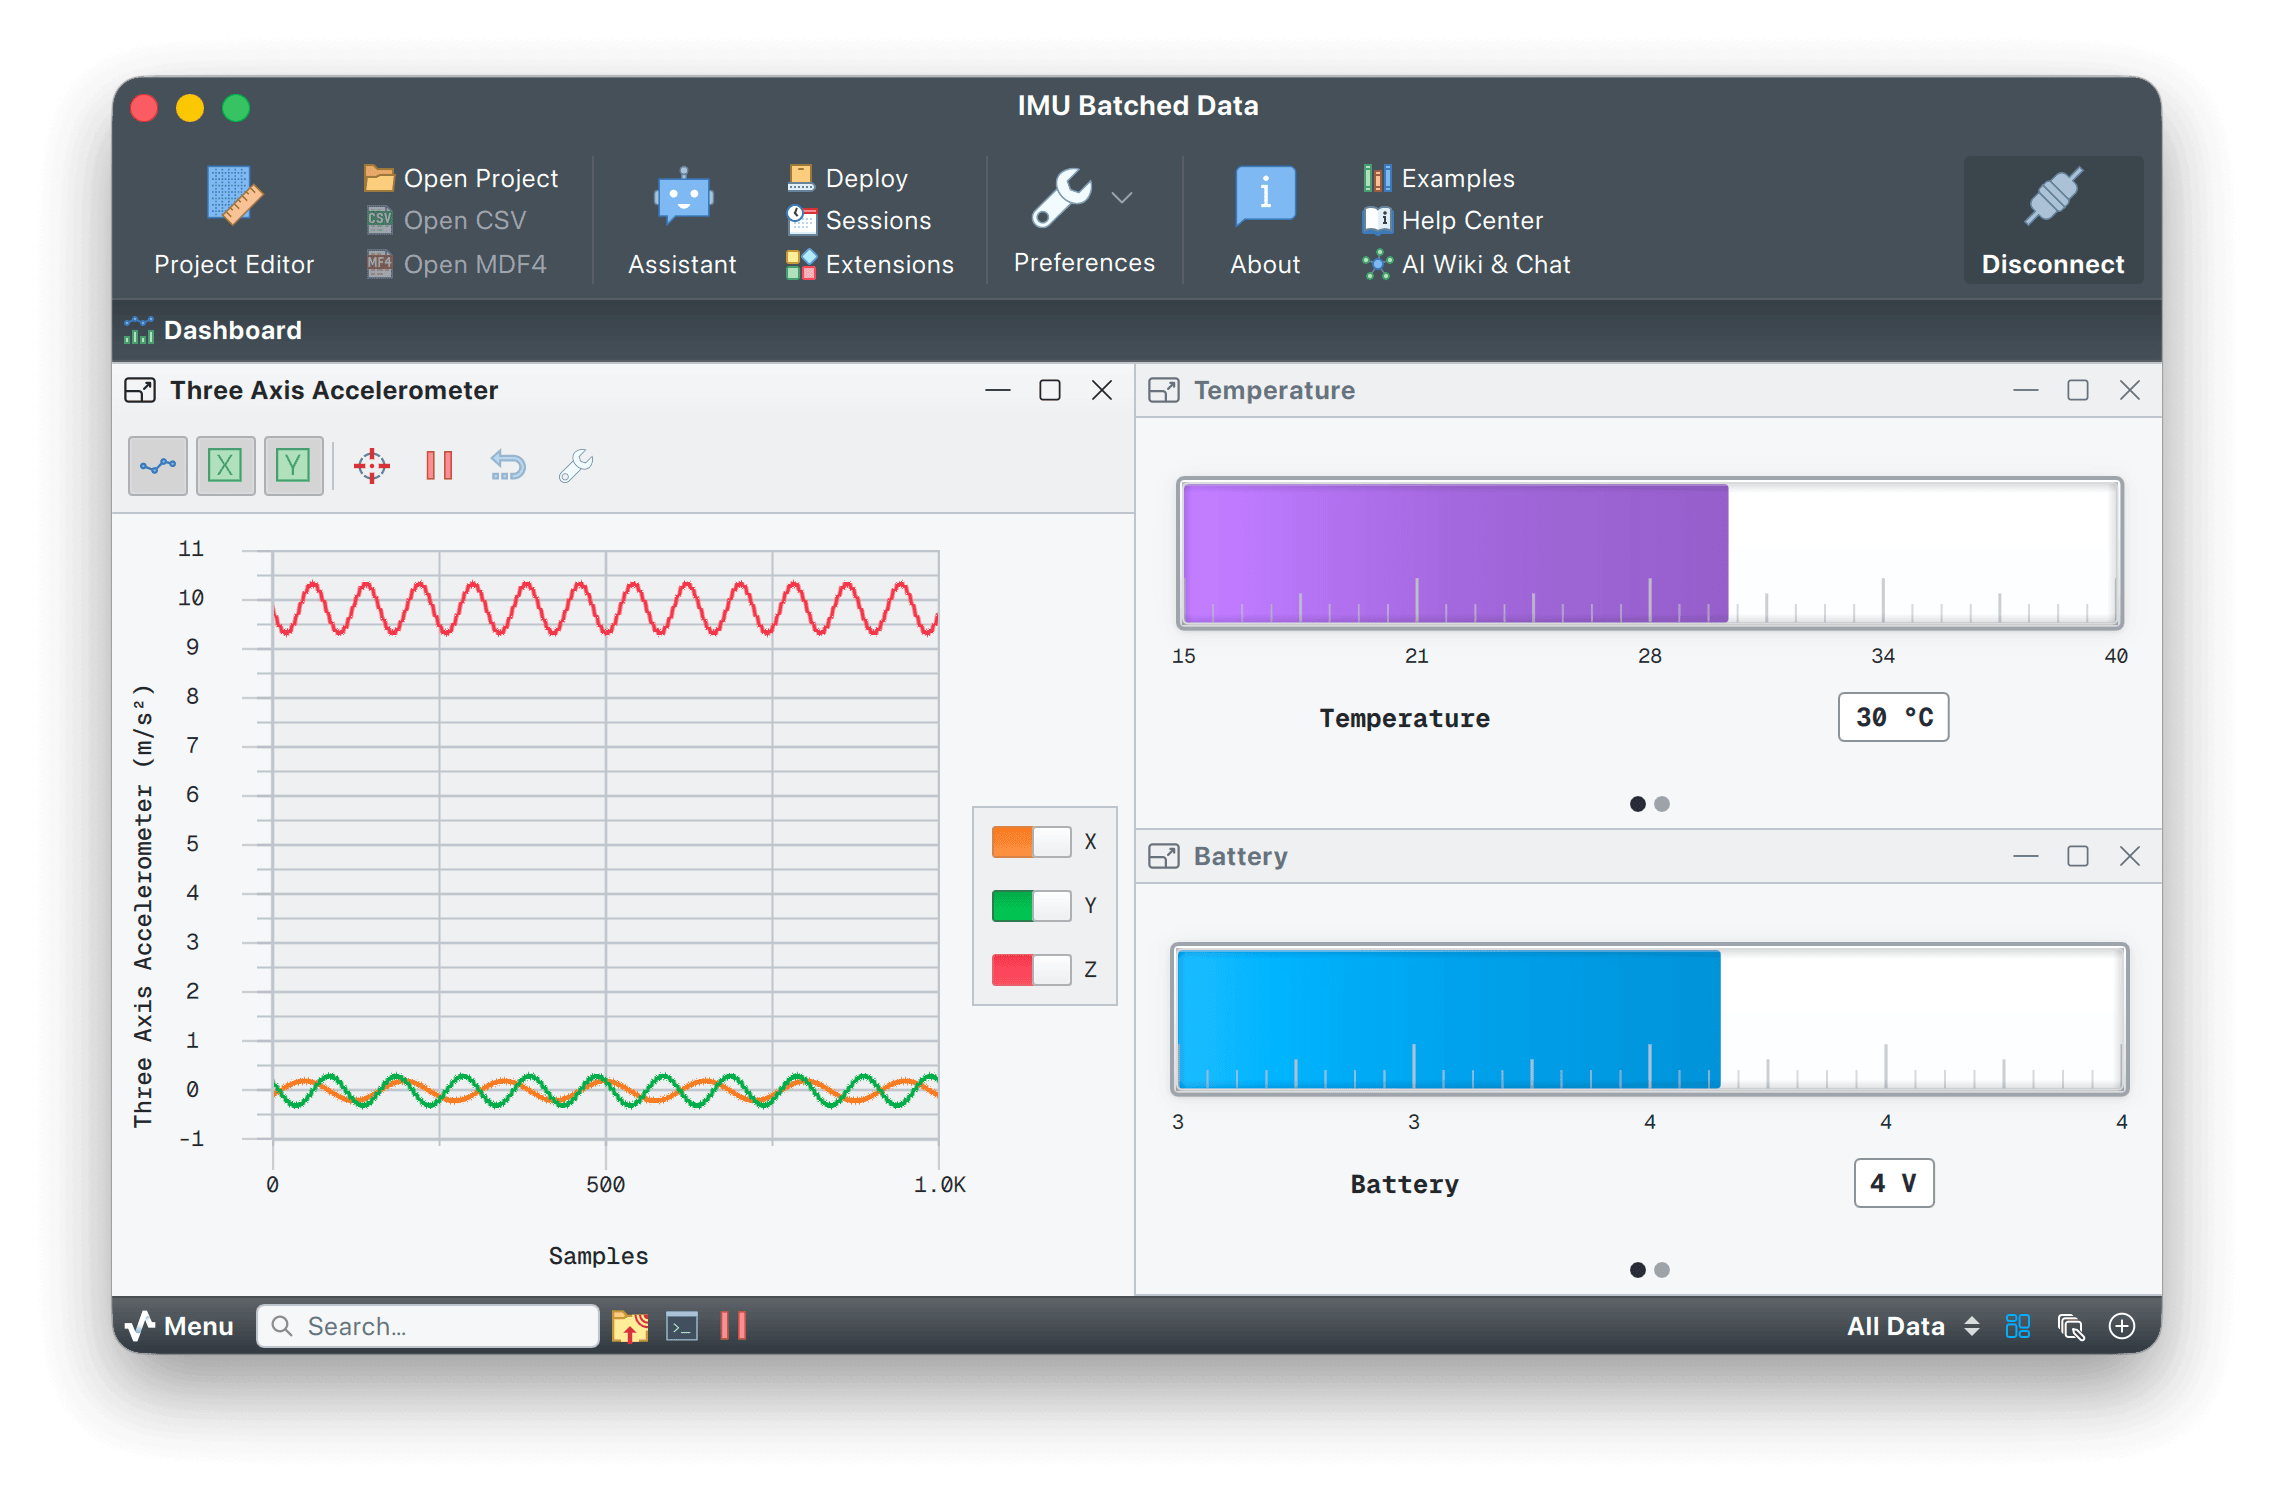
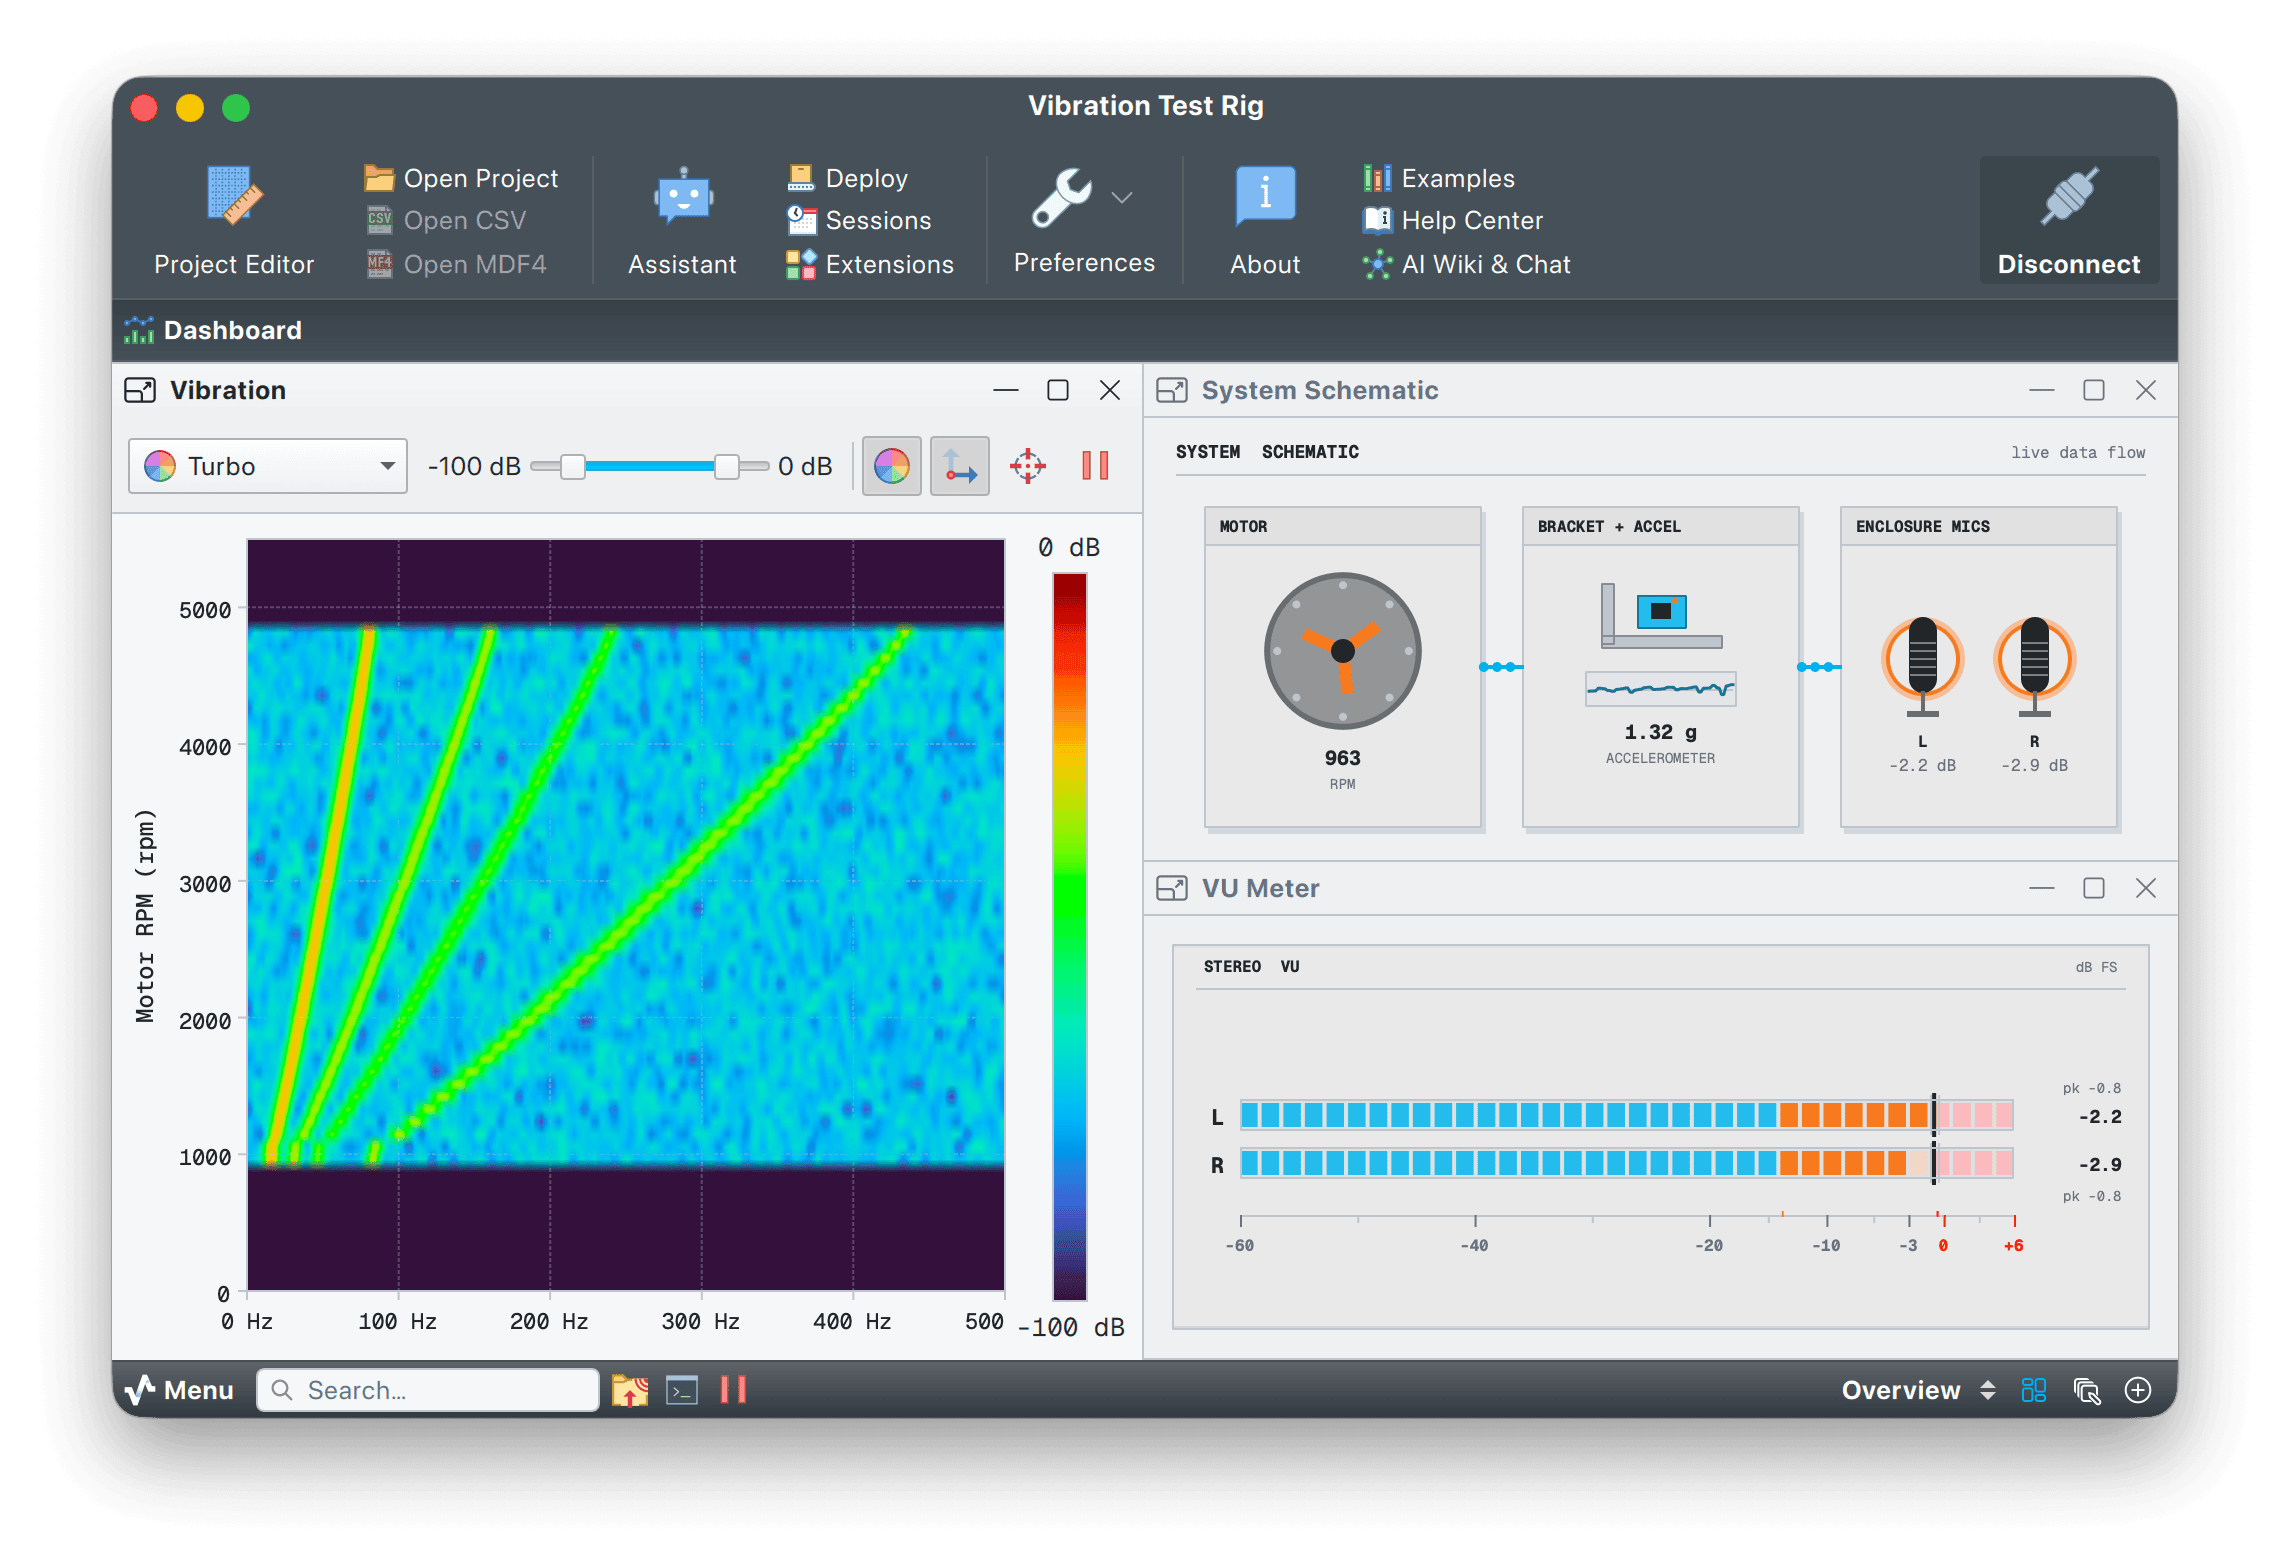
Four dashboards, one app
Real Serial Studio sessions. Same engine, different data. See the full gallery.
Features
Drivers, parsers, widgets, recording, scripting and integration. Nothing to install separately.
Native engine
Serial Studio is a native app, built in C++ on Qt 6. Every frame is processed the moment it arrives, and recording runs in the background, so the dashboard never has to wait. Runs on Windows, macOS, Linux and Raspberry Pi.
Ten bus drivers
Serial/UART, TCP/UDP and Bluetooth LE are free. Pro adds MQTT, Modbus, CAN Bus with DBC import, audio input, raw USB, HID and Process I/O.
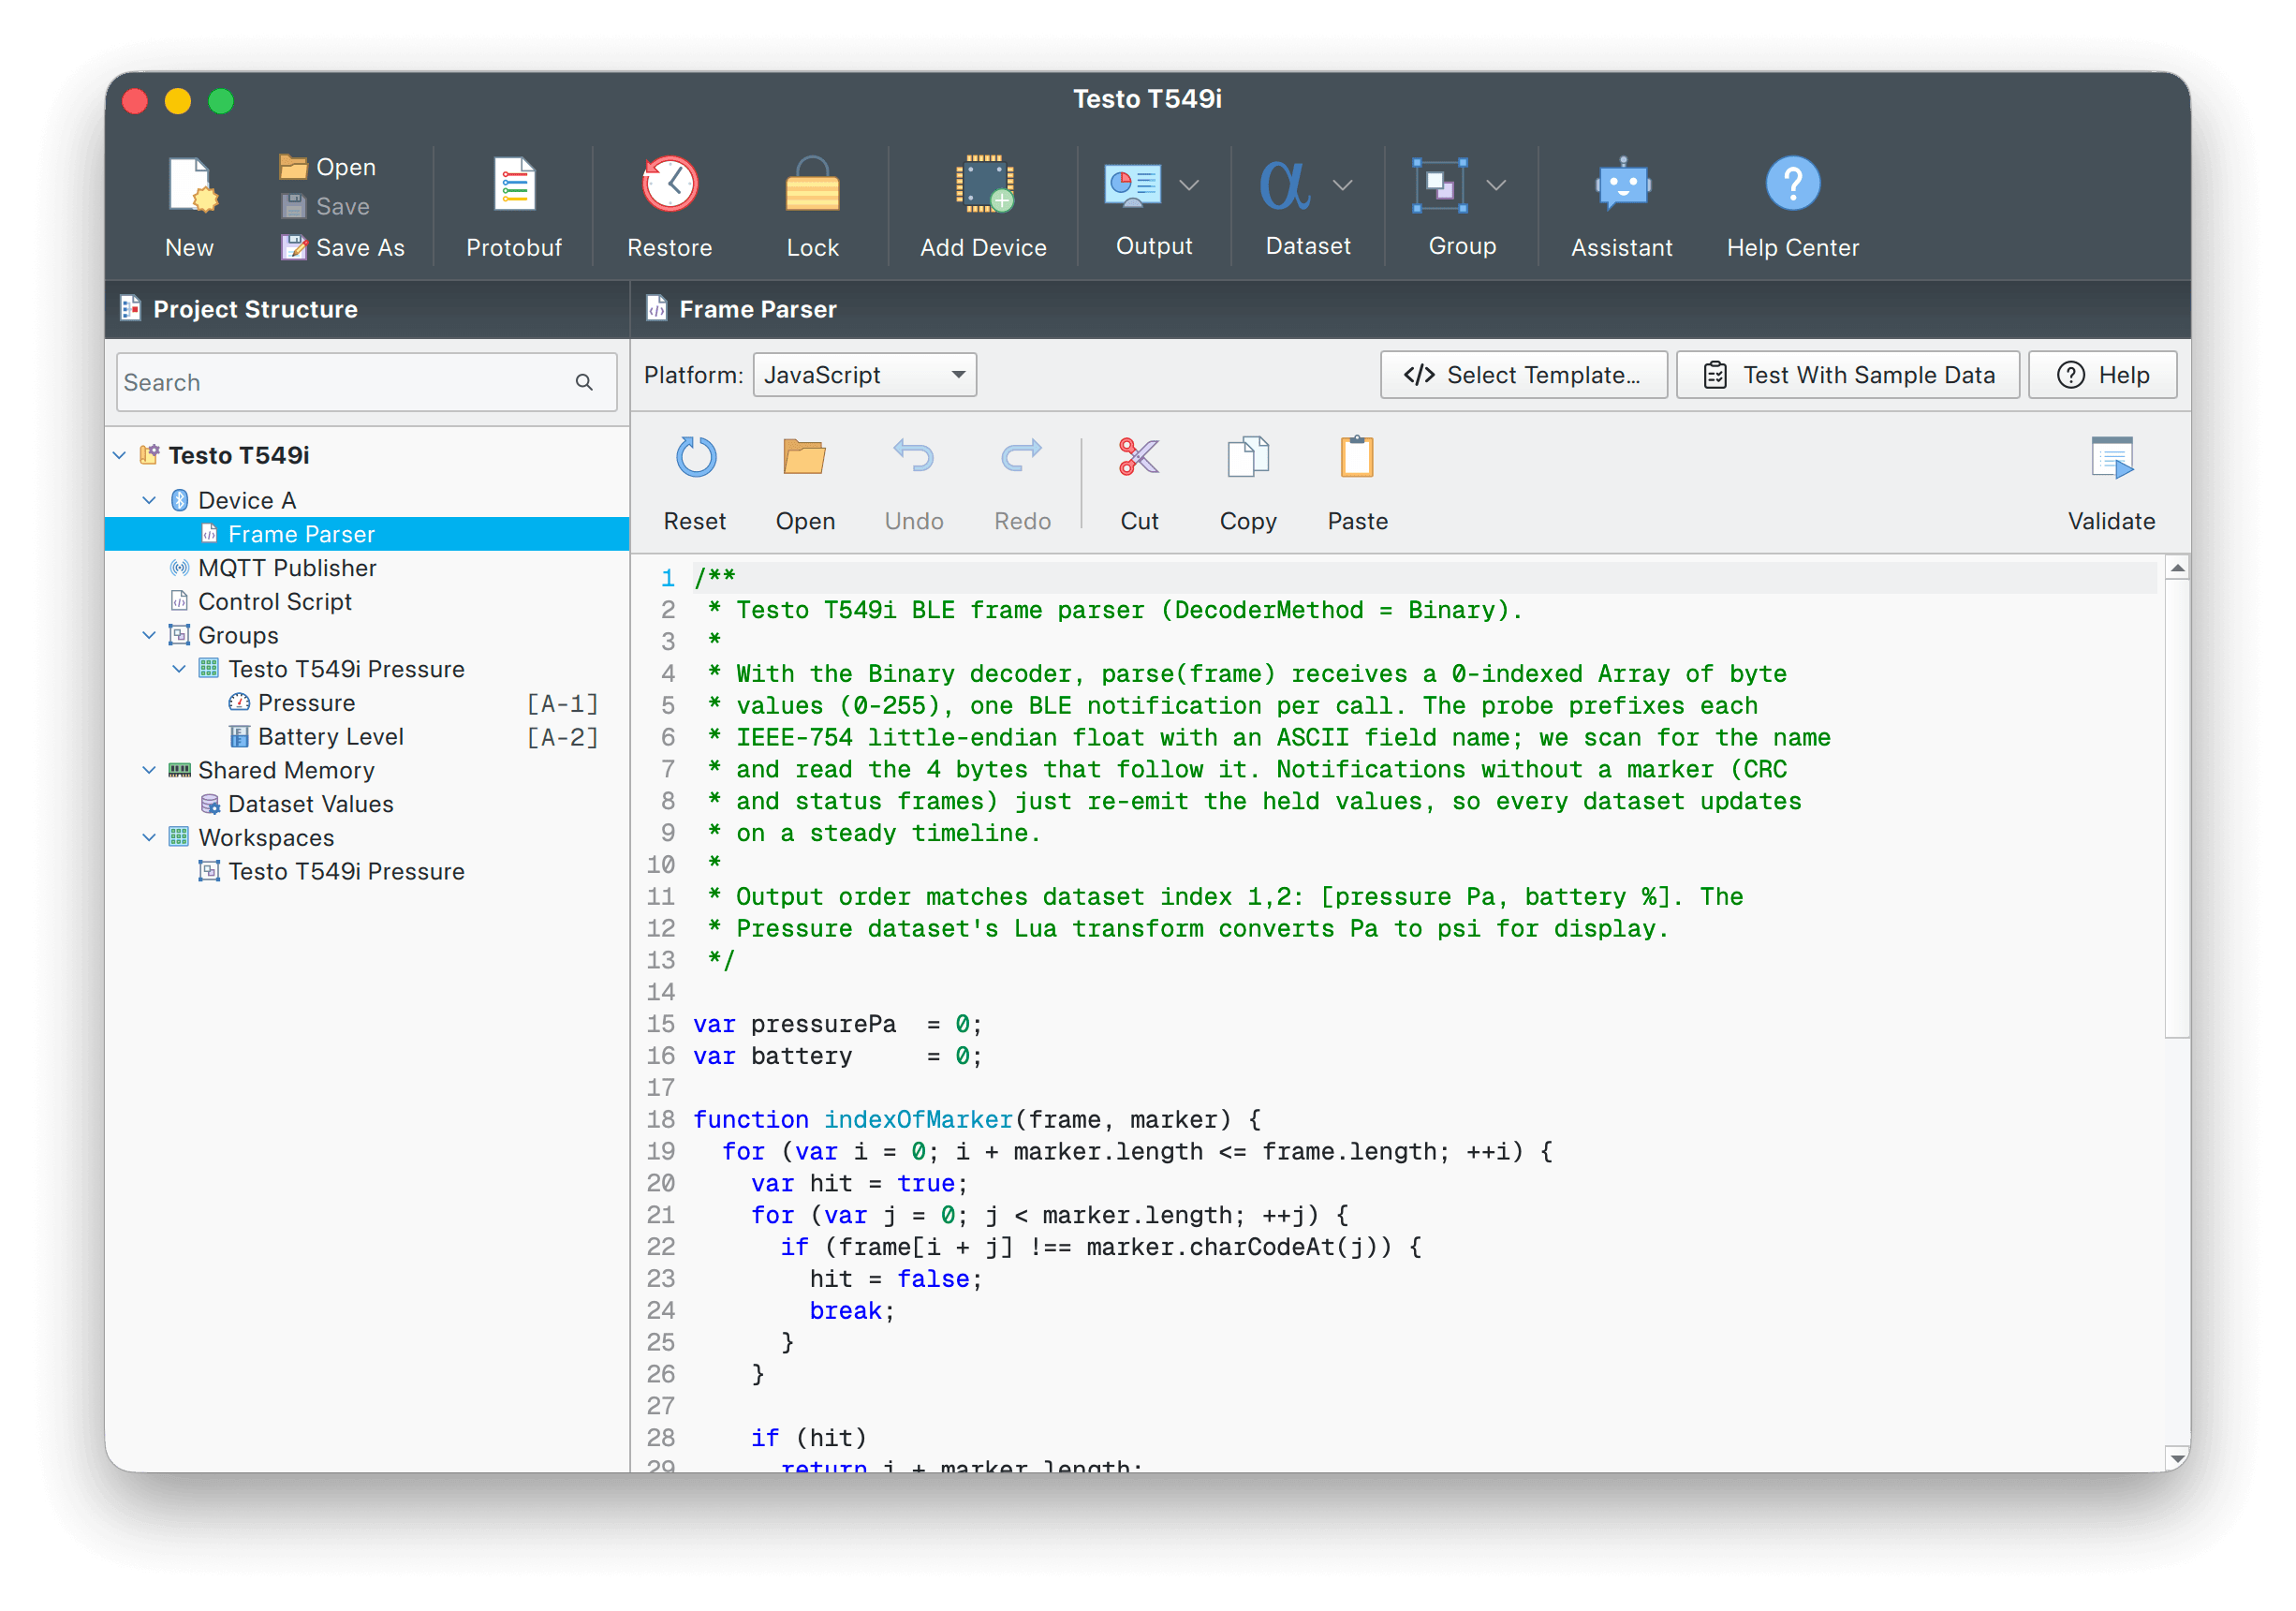
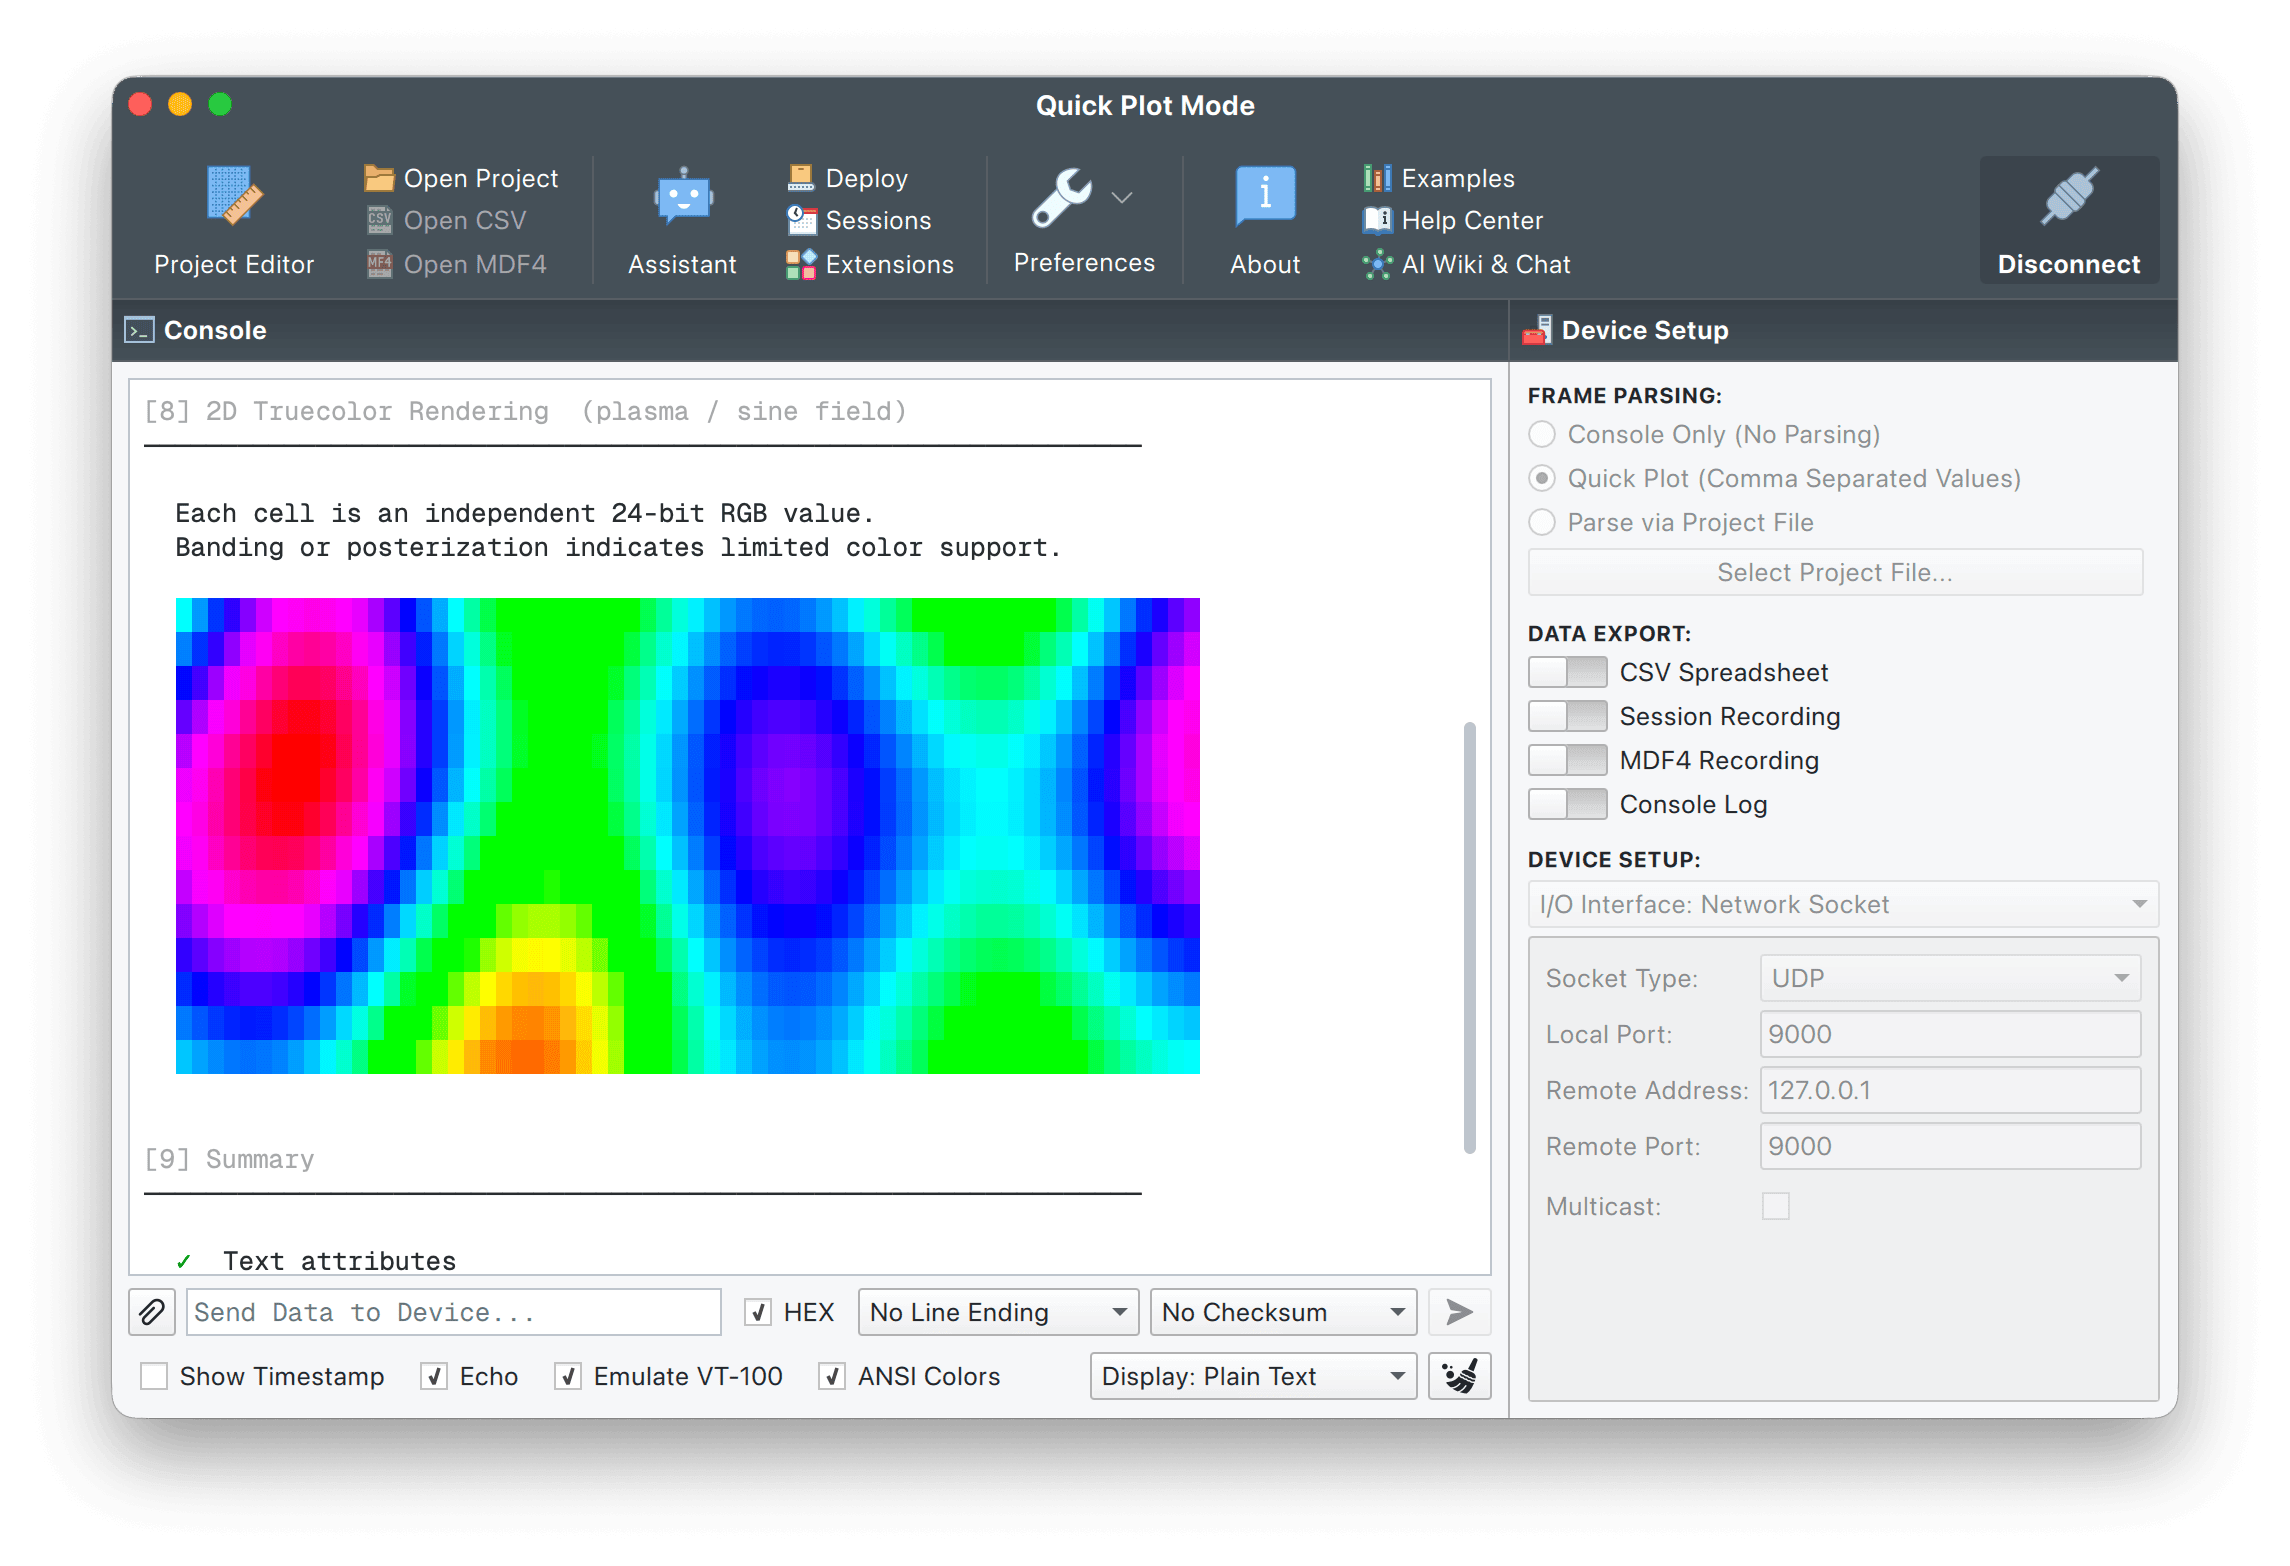
Visual project editor
Build dashboards with structured forms for groups, datasets and widgets. Quick Plot mode draws CSV streams without a project file.
20+ widgets
Plots, gauges, GPS maps, FFT, bars, compass, accelerometer, gyroscope, data grids and LED panels. Pro adds 3D Plot, XY Plot, Waterfall, ImageView and the scripted Painter.
Record, replay, report
Stream every frame to CSV in the free build. Pro adds MDF4 read and write, an SQLite session database with the Explorer, and one-click HTML or PDF session reports.
Decode without code
Built-In decoders handle delimited text, key=value, JSON, NMEA, Modbus and TLV from a form, with nothing to script. For everything else, write a JavaScript or Lua parser, or start from one of 28 templates, including MAVLink, UBX and MessagePack.
Control Loop automation
Drive the connected device with an Arduino-style setup() and loop(): send handshakes, poll registers and keep connections alive, without touching the firmware.
Painter widget (Pro)
Write a custom widget in JavaScript with a Canvas2D-style API. 18 templates ship in the box: oscilloscope, artificial horizon, polar plot, audio VU, dial gauge and heatmap.
Output controls (Pro)
Buttons, toggles, sliders, knobs, text fields and freeform output panels. JavaScript templates emit GCode, SCPI, Modbus, NMEA, CAN or a custom protocol, on demand or on a timer.
Multi-device projects (Pro)
Connect several devices in one project, each with its own protocol. CSV and MDF4 exports stay synchronised across sources.
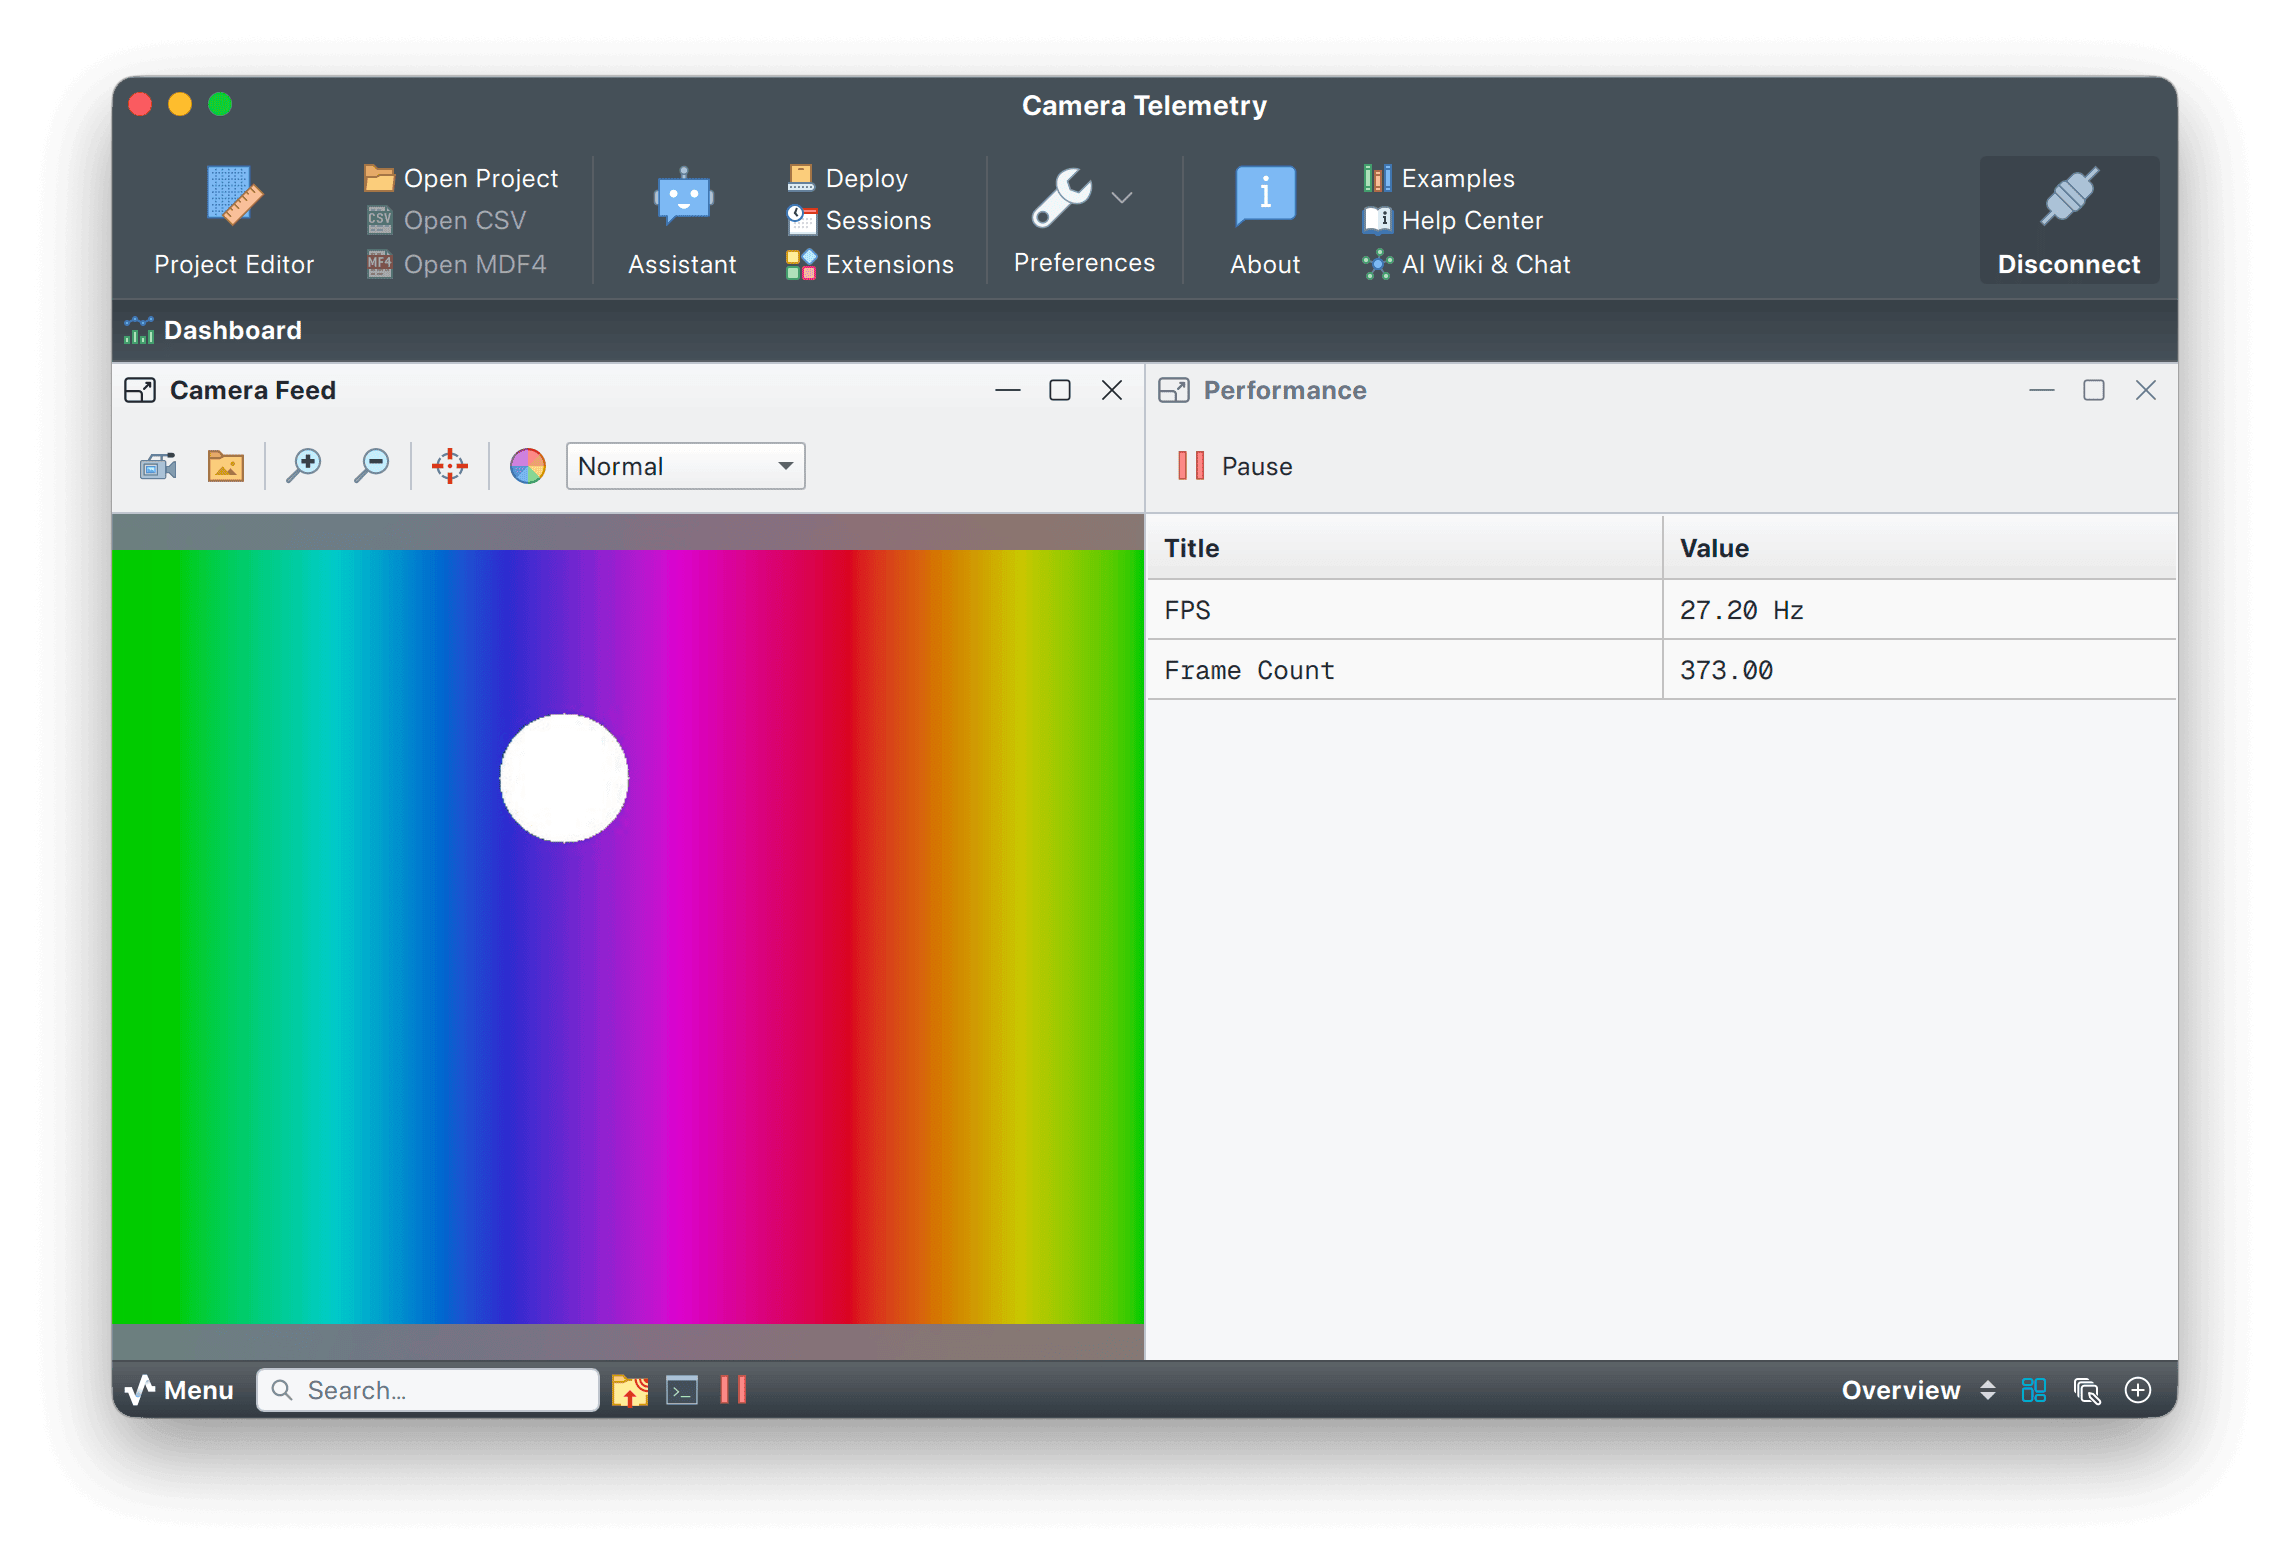
Live camera (Pro)
The ImageView widget pins a JPEG or PNG camera stream beside the rest of the dashboard. Zoom, pan, filter and snapshot.
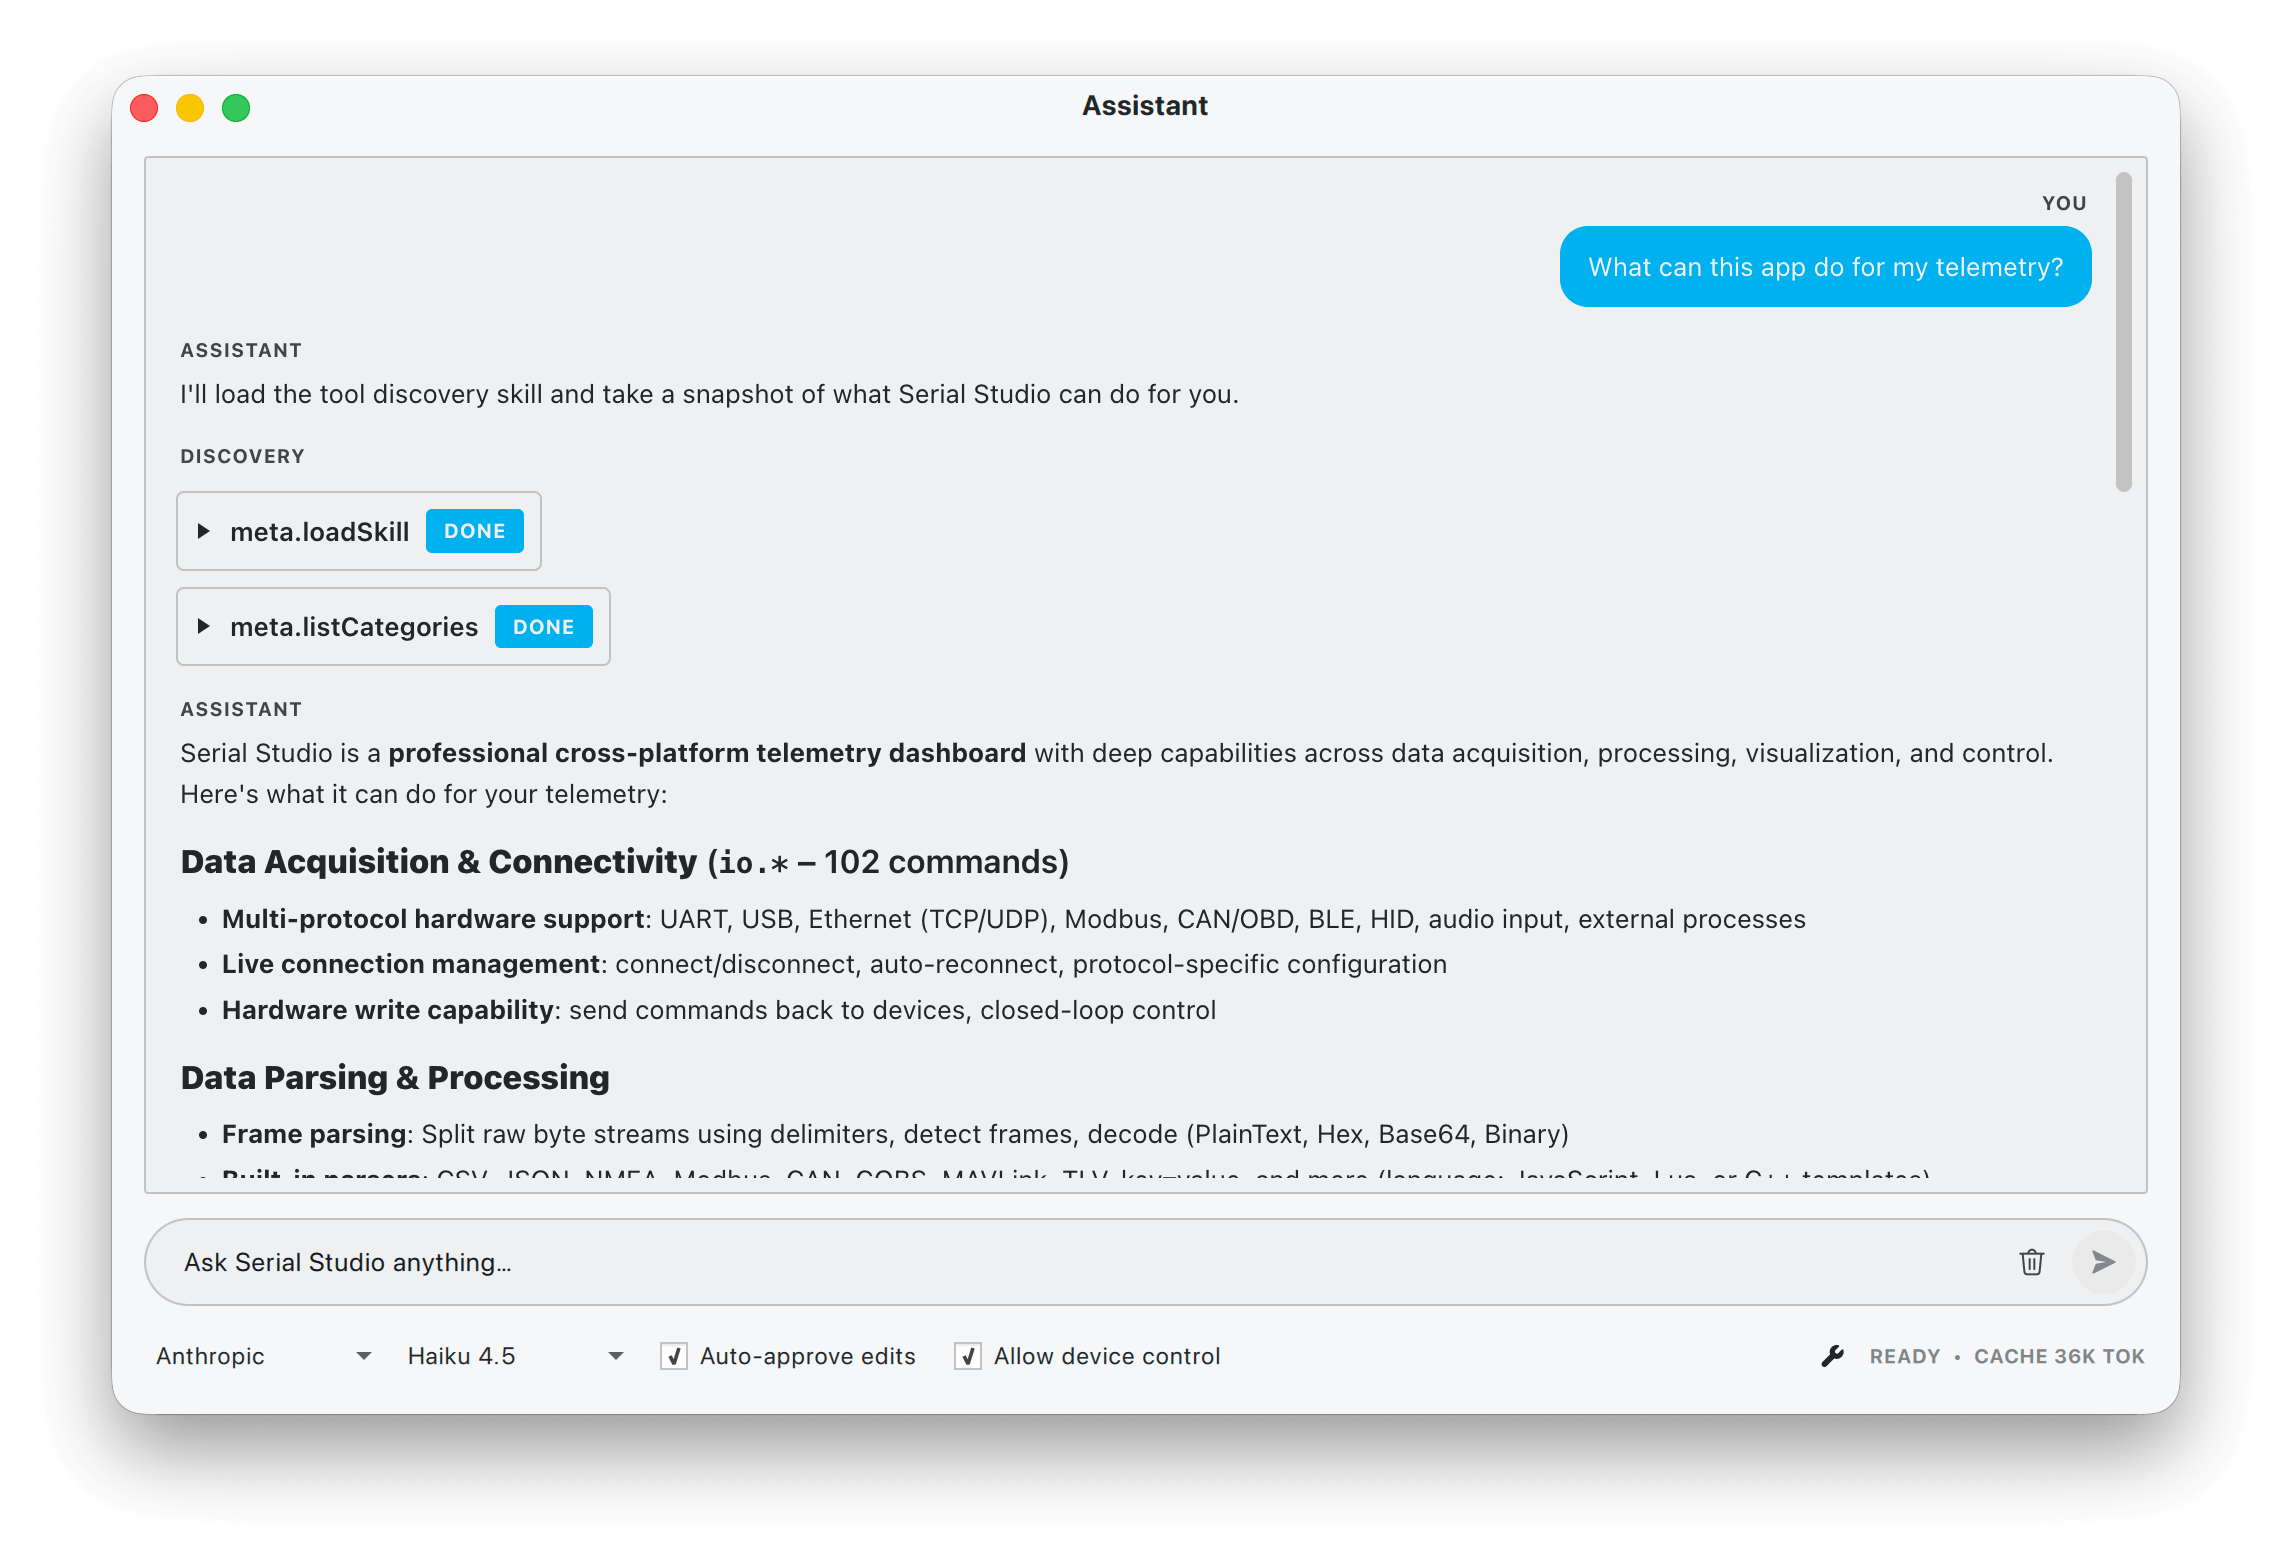
AI Assistant (Pro)
A chat panel that edits the project file alongside you. Bring your own key for Anthropic, OpenAI, Gemini, DeepSeek, Groq, Mistral or OpenRouter, or run fully offline against Ollama, llama.cpp, LM Studio or vLLM.
Data tables and transforms
Keep constants, computed registers and system values in one place, shared across the project. Transforms in JavaScript or Lua filter, scale and calibrate each dataset as frames arrive.
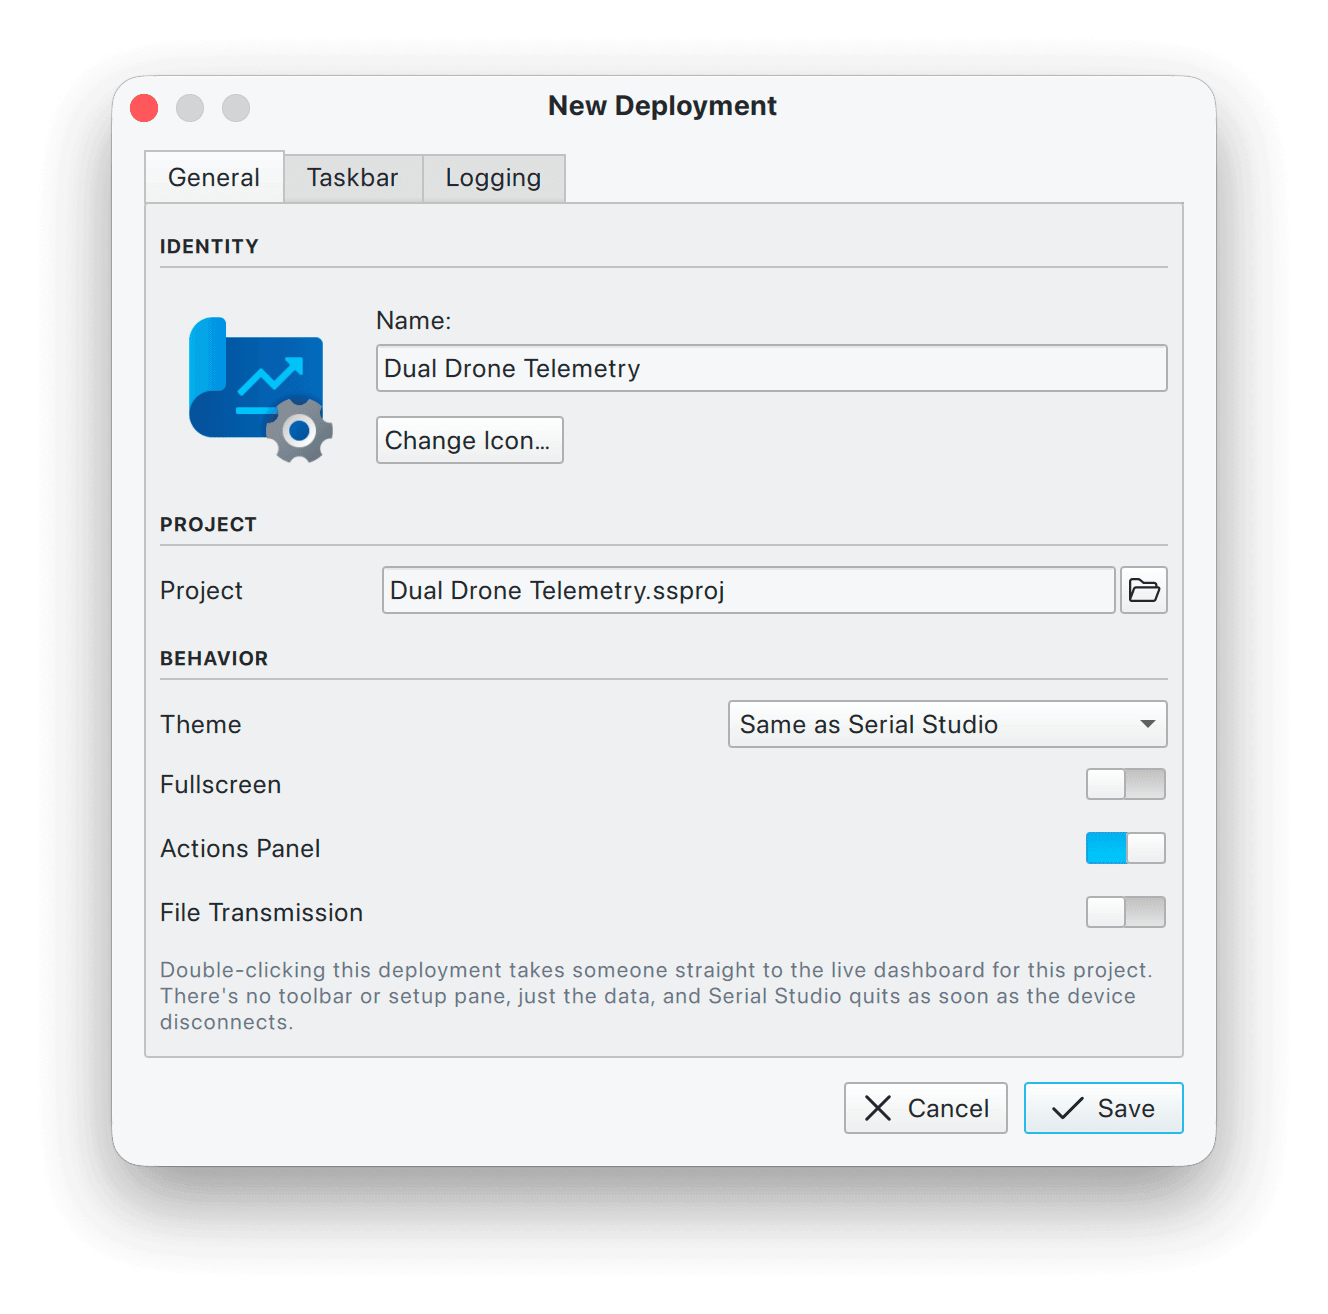
Operator deployments (Pro)
Lock a project file so operators see a read-only dashboard. Connection control, AI Assistant and device writes stay disabled. The same build runs on the bench and on the floor.
TCP, gRPC and MCP APIs
Control the entire app from your own code: 320+ commands over TCP, the same surface streamed over gRPC, and an MCP server so Claude Desktop and other AI hosts can drive it too.
File transfer (Pro)
Send firmware images, configuration files or scripts to the device straight from the console: plain text, raw binary, or XMODEM, YMODEM and ZMODEM with error checking and resume.
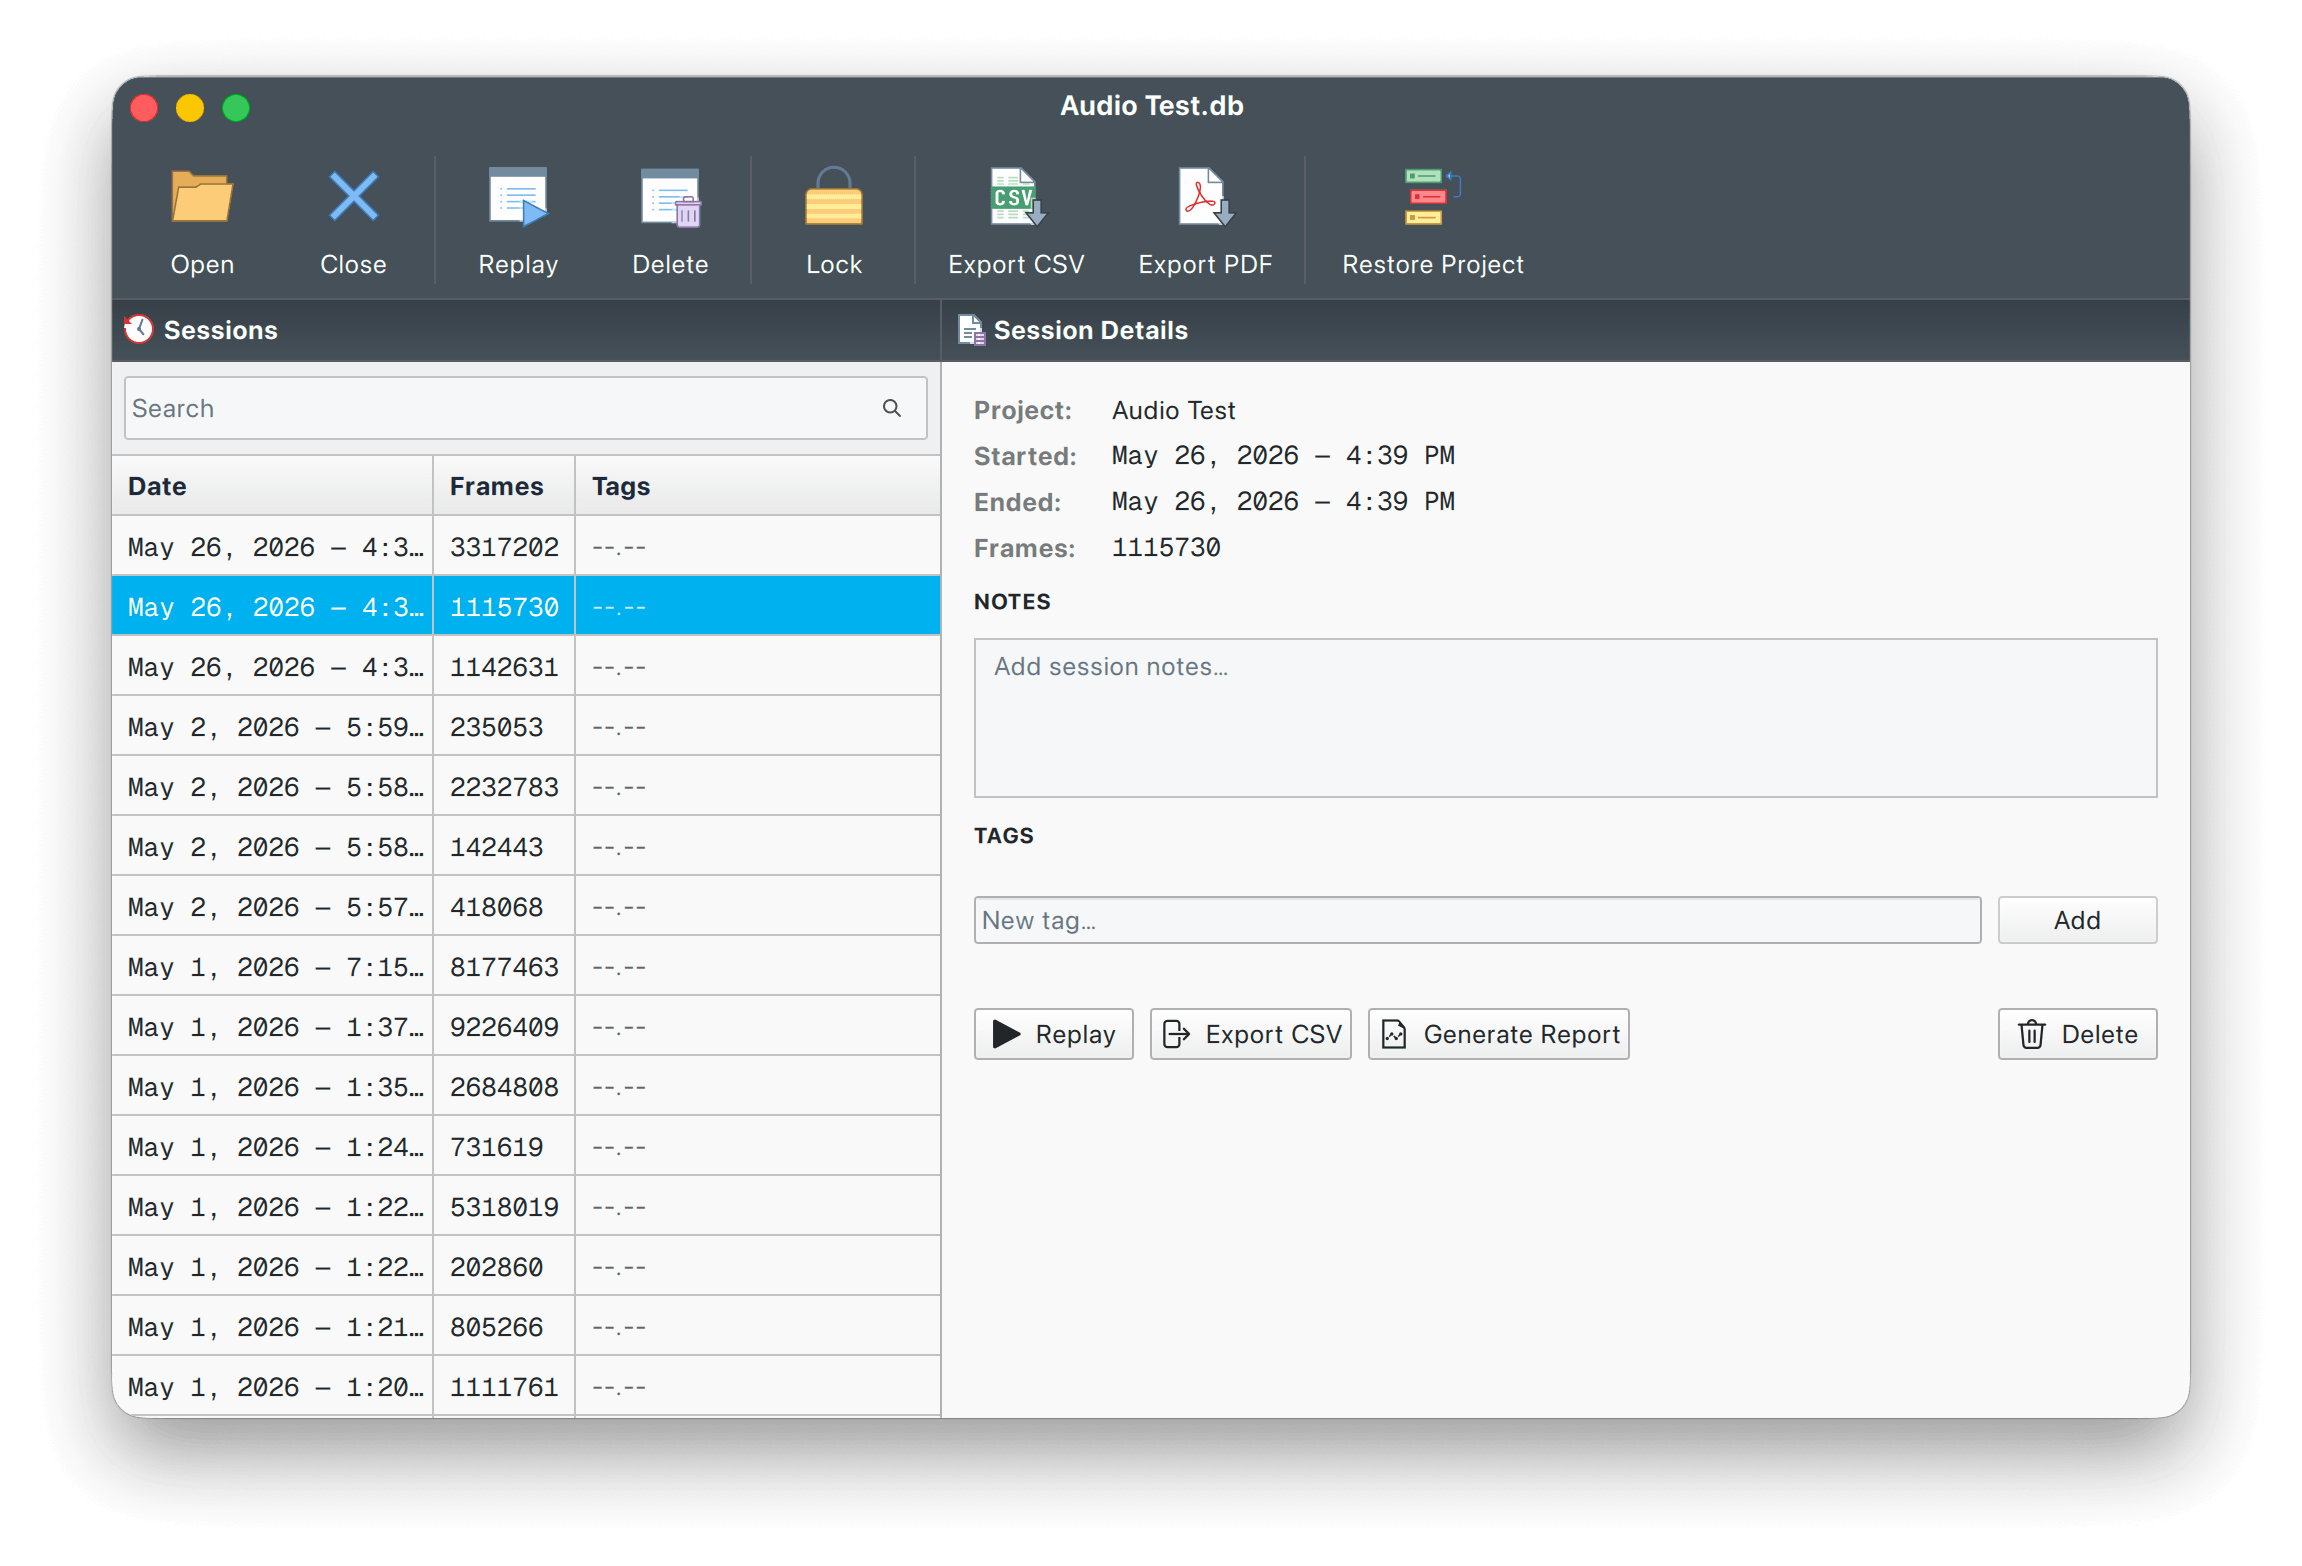
Session database (Pro)
Record frames and raw bytes into SQLite. Browse, tag, export and replay full sessions from the Database Explorer. Export a styled HTML or PDF session report with one click.
Open source core
The full source is on GitHub under GPLv3. Free for hobbyists, students and open-source work. Every official binary ships with a 14-day Pro trial.
Download Serial Studio
Native installers for Windows, macOS, Linux and Raspberry Pi. Each one includes a 14-day Pro trial, no card required.
Windows
Windows 10/11 (x64)
Download Installer (.msi)Also available on the Microsoft Store
Quick Start
Download the installer for your OS. No SDK, no toolchain, no build step.
Pick a serial port, BLE peripheral or network endpoint and open the connection.
Use Quick Plot for printed CSV, or design a custom dashboard in the Project Editor.
Every frame is logged to CSV. Replay the file later in the same dashboard.
Write a JavaScript or Lua parse() function and any binary protocol becomes datasets.
Poll and command the device with a setup()/loop() Control Loop, or drive the app over TCP, gRPC or MCP.
Recommend Serial Studio, earn a commission
Open to creators, educators, publishers and community builders. Approval is by application.
Tutorials, videos and blog posts that pay back
Share Serial Studio on a website, YouTube channel, newsletter, forum or social account. Lemon Squeezy tracks clicks and completed sales, and attributes each referral to your account.
Earn up to $159.80 per referral, with no cap on total commissions.
Open formats, no lock-in
Standard protocols, open file formats and mainstream scripting languages.
GPLv3 + commercial
Source on GitHub under GPLv3. Pro is the same code under a commercial license for closed-source and production use. Read the license.
MQTT 3.1.1 & 5.0
Publish, subscribe or bridge to any broker. TLS, authentication and retained messages.
Modbus RTU & TCP
Poll holding, input, coil and discrete-input registers. Bridge serial to TCP and back.
CAN Bus + DBC
Auto-decode signals from a DBC file. Read and write MDF4 session logs.
JavaScript & Lua
Frame parsers in either language. Bring existing protocol code as-is.
SQLite + CSV + MDF4
Session database, plain-text exports and ASAM MDF4 for automotive logs. All open formats.
TCP API + MCP
320+ JSON commands on TCP port 7777. The same surface speaks MCP for Claude Desktop and other hosts.
Cross-platform
Native builds for Windows, macOS, Linux x64 and Raspberry Pi ARM64. One project file across all of them.
14 days of Pro free, no card required
Every Pro feature is on during the trial. If the standard widgets, scripting and CSV recording cover your work, compile the GPLv3 source after day 14 at no cost. If you need MQTT, Modbus, CAN, MDF4 or the AI Assistant, activate a Pro license.


Frequently asked questions
Short answers to the questions people ask before downloading. The Help Center FAQ goes deeper.
What is Serial Studio?
Serial Studio is a native cross-platform desktop application that turns data from your hardware into a live dashboard. It speaks UART, Bluetooth LE, TCP/UDP, MQTT, Modbus, CAN Bus, audio, raw USB, HID and process I/O, and visualises the data through plots, gauges, GPS maps, FFTs, 3D views and a scriptable Canvas2D widget.
Is Serial Studio free?
Yes. The GPL-3.0 source build is free and covers Serial/UART, TCP/UDP and Bluetooth LE with 15+ widgets, CSV export, JavaScript and Lua frame parsers, the TCP API and MCP server. Pro adds MQTT, Modbus, CAN Bus, audio, USB, HID, the 3D and waterfall widgets, MDF4, session database, the AI Assistant and more. Pro starts at $9.99/month, with a $349 lifetime option. See pricing.
Which platforms does Serial Studio run on?
Windows 10 and 11, macOS 13 and later (Intel and Apple Silicon), Linux x86_64 and ARM64, and Raspberry Pi. An AppImage, deb/rpm packages, and a Flathub package are also available.
Can Serial Studio decode CAN Bus DBC files?
Yes. The Pro CAN Bus driver imports DBC files and decodes signals automatically for classic CAN and CAN FD. Logs can be exported and replayed as MDF4. See the CAN Bus driver docs.
Does Serial Studio support MQTT?
Yes, in the Pro edition. Serial Studio can publish telemetry from local hardware to an MQTT broker and subscribe to topics from anywhere, bridging your bench equipment into an IoT pipeline. See the MQTT driver docs.
Can I use Serial Studio commercially?
Commercial use requires the Pro edition. The free build is GPL-3.0 and is restricted by the GPL terms; for proprietary integration inside a company, choose Pro, Small Business or Enterprise.
How does Serial Studio compare to Arduino IDE Serial Plotter or PuTTY?
Serial Studio is built for production telemetry, not just a single plot. It decodes structured frames with code-free Built-In templates or JavaScript and Lua parsers, supports 10 bus drivers (not only USB serial), draws 20+ widgets, records and replays sessions to CSV or MDF4, and exposes a TCP API, gRPC server and MCP server for automation. The Arduino Serial Plotter and PuTTY are useful for quick checks; Serial Studio replaces the custom dashboard you would otherwise have to build.
Can Serial Studio automate a connected device?
Yes. The Control Loop gives every project an Arduino-style setup() and loop(). setup() runs once when the device connects and loop() runs while it stays connected, so the script can send wake-up handshakes, poll Modbus registers or AT commands on a timer, issue keep-alives or step a state machine, all without changing the device firmware.
Does Serial Studio have an API?
Yes, three surfaces that share one command set of 320+ commands: a TCP JSON-RPC API on port 7777, a gRPC server on port 8888 with typed protobuf streaming, and an MCP server so Claude Desktop and other MCP hosts can drive the app. See the API reference.
How do I visualize Arduino data with Serial Studio?
Print comma-separated values from your Arduino sketch, open Serial Studio, pick the serial port and baud rate, then enable Quick Plot mode. For a structured dashboard with gauges, maps and 3D views, define your data format in the Project Editor or let the AI Assistant generate the project for you.
Sales, licensing and partnerships
For technical support, file an issue on GitHub. For everything else, this form reaches Alex directly.
Support channels
Open a GitHub issue for technical questions, feature requests and bug reports. Every release-blocking bug is triaged there. For licensing and commercial questions, email directly.