Sign the Test Report, Not the Spreadsheet
Test-stand QA usually ends in a hand-assembled spreadsheet. Session recording and generated reports turn a run into a document derived from the data itself.

There is a workflow that almost every test stand converges on, and almost nobody chose. A run finishes. Somebody exports a CSV. The CSV goes into Excel. Somebody makes charts, adjusts the axes, pastes them into a template, types the min and max into a table, exports a PDF, and sends it for signature.
It works. It also has a property nobody likes to say out loud: the document is not derived from the data, it is assembled next to it. Every number in that summary table was retyped or hand-formulated. Every chart is a snapshot somebody chose the range for. Six months later, when a customer asks why the pressure trace looks like that, the answer depends on whether the original CSV still exists and whether anyone remembers which of four files it was.
The alternative is not fancier charting. It is to record the session as a first-class artifact and generate the document from it.
Record the run, not a file per run
The first shift is where the data lives. CSV export gives you a file per session, and a directory full of 2026-08-20_14-03-11.csv is not an archive, it is sprawl. Cross-session comparison means opening several of them and hoping the columns line up.
Serial Studio's Historian records every connected session into a single SQLite database per project:
<Workspace>/Session Databases/<Project Title>/<Project Title>.db
All sessions for a project live in that one file, separated by row rather than by file. That is what makes "show me every run of this test in August where the outlet temperature exceeded 80" a query instead of an afternoon.
Recording runs in parallel with the dashboard. Frames, raw bytes and table snapshots are enqueued lock-free on the main thread and written by a background worker in batched transactions, so the disk never blocks the data path. You turn on Session Recording under Data Export and there is nothing else to configure: the path, the schema and the file lifecycle are handled.
What is actually captured
Three per-sample streams and two metadata tables:
| Data | Table | Contents |
|---|---|---|
| Dataset values | blocks |
Final and pre-transform values for every published block |
| Raw bytes | raw_bytes |
Every byte that arrived on the driver, exactly as received |
| Shared tables | table_snapshots |
Shared-table variables, captured on change at 1 Hz |
| Session metadata | sessions |
Project title, start, end, embedded project JSON, notes |
| Column layout | columns |
Dataset title, group, units, widget type |
Two of those deserve attention.
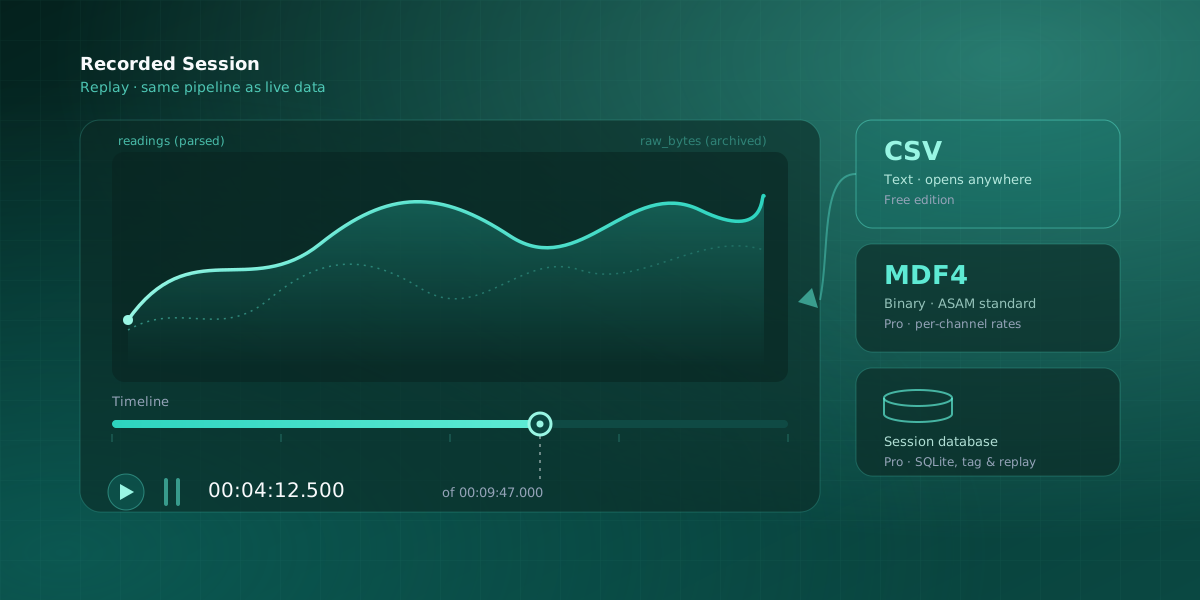
Raw bytes are kept alongside parsed values. If a year later someone disputes a reading, you are not arguing about a number in a spreadsheet. You have what came off the wire. Replay re-renders from the stored parsed values rather than re-parsing, so the archive of raw bytes is there for inspection and external analysis rather than being on the critical path.
The project is embedded in the session. sessions.project_json is a snapshot of the project at the moment recording started. That is what lets a session recorded in March replay faithfully in September, after the live project has been edited half a dozen times. Without it, "replay" quietly means "re-render old data through a new configuration", which is not the same thing at all and is exactly the sort of difference that invalidates a comparison.
It is a plain SQLite file
No custom container, no compression, no encryption. Any SQLite client opens it directly, so recorded sessions are usable from your own software without going through the application at all. That matters for a QA workflow more than it might seem: your archive does not depend on a vendor's continued goodwill or file format.
The schema evolves additively, with new columns and tables added and existing ones never renamed or reordered, so a query that names its columns keeps working across upgrades. The database runs in Write-Ahead-Logging mode, which means reading it while a recording is in progress is safe. Open it read-only from outside (file:...?mode=ro in SQLite URI syntax), because an external writer holding a lock can stall or corrupt an active recording.
One detail to know before you write your first query: every *_ns column counts nanoseconds from the session's first recorded sample, not from the Unix epoch. The wall-clock anchor is sessions.started_at, an ISO 8601 local timestamp. Add the two to place a sample in calendar time.
The report is generated, not assembled
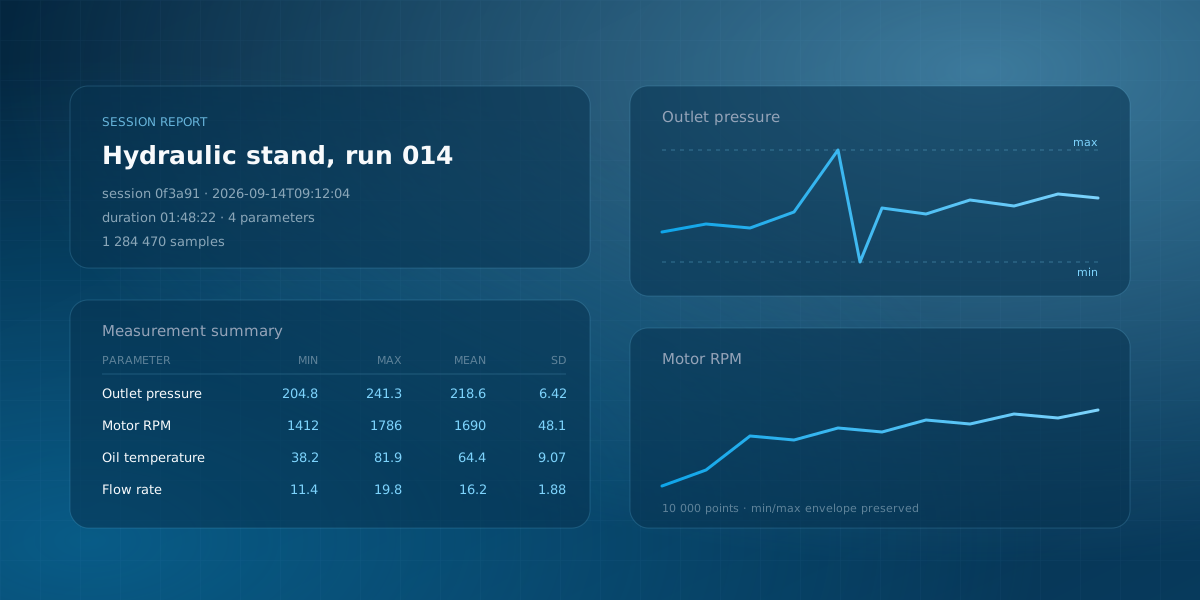
Once a session is an object rather than a file, the document becomes a rendering of it. Open the Historian, select a session, and generate a report with four sections you can toggle independently:
- Cover page. Logo, company name, document title, project name, session ID, duration, sample count, parameter count, start and end timestamps, author, generation date.
- Test information. Project title, session ID, times, duration, counts, tags as chips, and session notes.
- Measurement summary. One row per parameter with sample count, min, max, mean and standard deviation. Non-numeric datasets show a dash rather than a fabricated zero.
- Parameter trends. One chart per numeric dataset, each starting its own page when printed, plus a screen-only overlay chart that puts every parameter on shared axes for shape comparison.
Branding is configured once per project and persists: company name, document title, author, and a PNG, JPG or SVG logo embedded inline. Page size runs A0 through A6, B4, B5, Letter, Legal, Executive, Tabloid and Ledger, always printed landscape. Line width and style are adjustable, and there is a checkbox to annotate min, max and mean directly on each plot.
The Datasets tab decides what feeds the summary and the trends, which is the part that turns a raw capture into a report someone will actually read. A test stand might log ninety channels; the deliverable covers eleven.
Every number in that summary table is computed from the recorded samples. Nobody typed it.
The downsampling question
Long sessions get downsampled for the charts, to a maximum of 10,000 points each, using first/min/max/last bucket decimation across 2,500 equal-count buckets.
That algorithm choice is the one worth knowing about, because naive downsampling is how you lose a spike. Taking every nth sample will eventually step straight over a 3 ms excursion that is the entire reason the test was run. Keeping the first, minimum, maximum and last of each bucket preserves the envelope: peaks and valleys survive, and the chart stays honest about the range even when it cannot draw every point.
If you need full resolution, export the session to CSV from the Historian. The report is a summary artifact by design; the archive is the record.
HTML or PDF
Both formats carry the same content from the same template, and which one you get is determined by the build. Builds with the embedded browser engine export PDF; builds without it export a self-contained HTML file.
They are good at different things. HTML keeps interactive Chart.js charts with hover, tooltips and the overlay toggle, inlines the library, stylesheet and logo so the single file works offline, and renders near-instantly for any session size. PDF rasterizes the charts, so it is smaller and fixed per page count, and it is what you want for a customer deliverable or anything that will be printed or filed.
Charts use Chart.js bundled inside the application, so no network access is required to render a report. On an air-gapped test bench that is not a nice-to-have.
Why this changes the QA conversation
The practical difference shows up in three places.
Reproducibility. The report pulls session data directly from the database, independently of the live project. You can regenerate a report from an archived session long after the original project has changed, and get the same document.
Provenance. Raw bytes, parsed values, the project configuration and the operator's notes are in one row-addressable place, tied to a session ID that appears on the cover page. A question about a number has an answer that does not depend on anyone's memory.
Time. The part of the old workflow that consumed an afternoon, meaning chart-making and retyping statistics, is the part that is now generated. What is left is the part that actually needs judgment: deciding which channels matter and writing the notes.
None of this makes a report a legally signed record on its own. What it does is remove the hand-assembly step between the measurement and the document, which is where the errors live.
Trying it on a stand you do not have
You do not need a test bench to see the whole path. The Modbus PLC Simulator example runs a physics-based hydraulic test stand as a Modbus TCP server, cycling through startup, steady running, pump cavitation, emergency stop and a controlled restart. Connect to it, turn on Session Recording, let it run through a failure and a recovery, then open the Historian and generate a report on what happened.
That is a realistic rehearsal of the actual workflow, including the bit where the interesting event is a thirty-second excursion in the middle of a long quiet run, which is exactly the case the bucket decimation is there to survive.
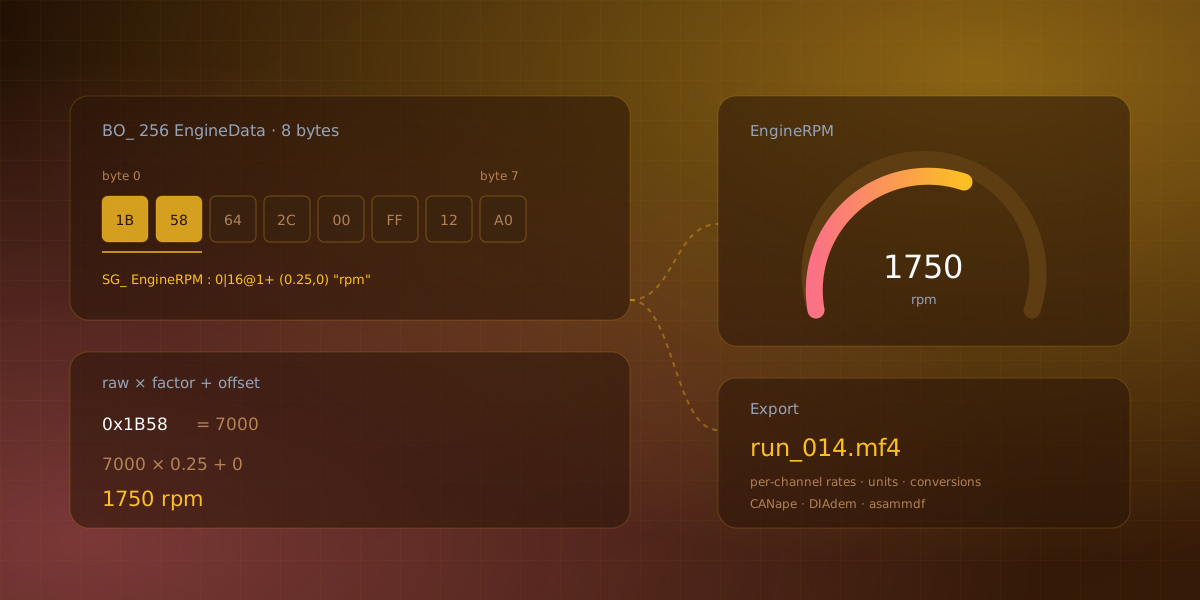
The Historian, session reports and MDF4 export are part of the Pro build rather than the GPLv3 one, and the fourteen-day trial unlocks them. The simulator page covers what you can evaluate with no hardware on the desk.
Comments